
 Anchor Alarm
Meteo — weather, tides, and alerts
The Meteo tab brings together everything you need to read the sea before
you trust it.
A segmented bar at the top has three sections:
Marine Weather — Events — Meteogram.
Weather pins
Above the segmented bar sits a strip of circular weather avatars — one
for every location you have pinned for weather. Each avatar shows the sky
glyph from that location's saved report plus how long ago the report was
fetched. The ring colour is the age at a glance: white ring while the report
is fresh (under ~3 h), amber as it ages, grey once it is stale (older than
12 h).
fetches for your vessel is saved as a report automatically — a My
Position avatar leads the strip from your first launch, no tap needed,
and it keeps following your vessel's weather fetches as you sail. Delete
it and it stays gone until you re-add it with +.
in place, and all three segments now read from that pin's saved report.
Marine Weather shows its headline conditions, hourly strip, alerts,
and refresh / remove actions; Events its weather alerts; Meteogram
the full forecast chart for the pin's coordinate — not your vessel's.
Everything is stored on the device, so it appears instantly and works
offline; the age keeps counting up so you always know how old what you're
reading is. Tap the My Position avatar to return to the classic
current-location dashboard.
the windier it is there — a calm anchorage idles, a gale spins. Its
small green scope badge jumps straight to the SeaTracker chart,
centred on the pin.
brings it back.
reuses the weather the app already fetched — the report shows instantly,
correctly aged to when it was actually downloaded, and only re-fetches
when it is genuinely stale.
human-readable location under the raw coordinates — *"Kassiopi, Ionian
Islands · Greece" on land, the sea area ("Aegean Sea"*) offshore — the
same label the chart's location badge uses, so a pin dropped mid-passage
still tells you where the forecast applies.
quietly re-fetches any report older than an hour when it launches.
Weather pins also appear as round badges on every chart — SeaTracker and
the SafeAnchor anchor-watch chart alike — with a compact
temperature · wind · age caption, and they grey out as their report ages.
You can hold up to 12 pins; pinning a harbour, marina, or anchorage from
its detail sheet lands here too (see
Marine Weather
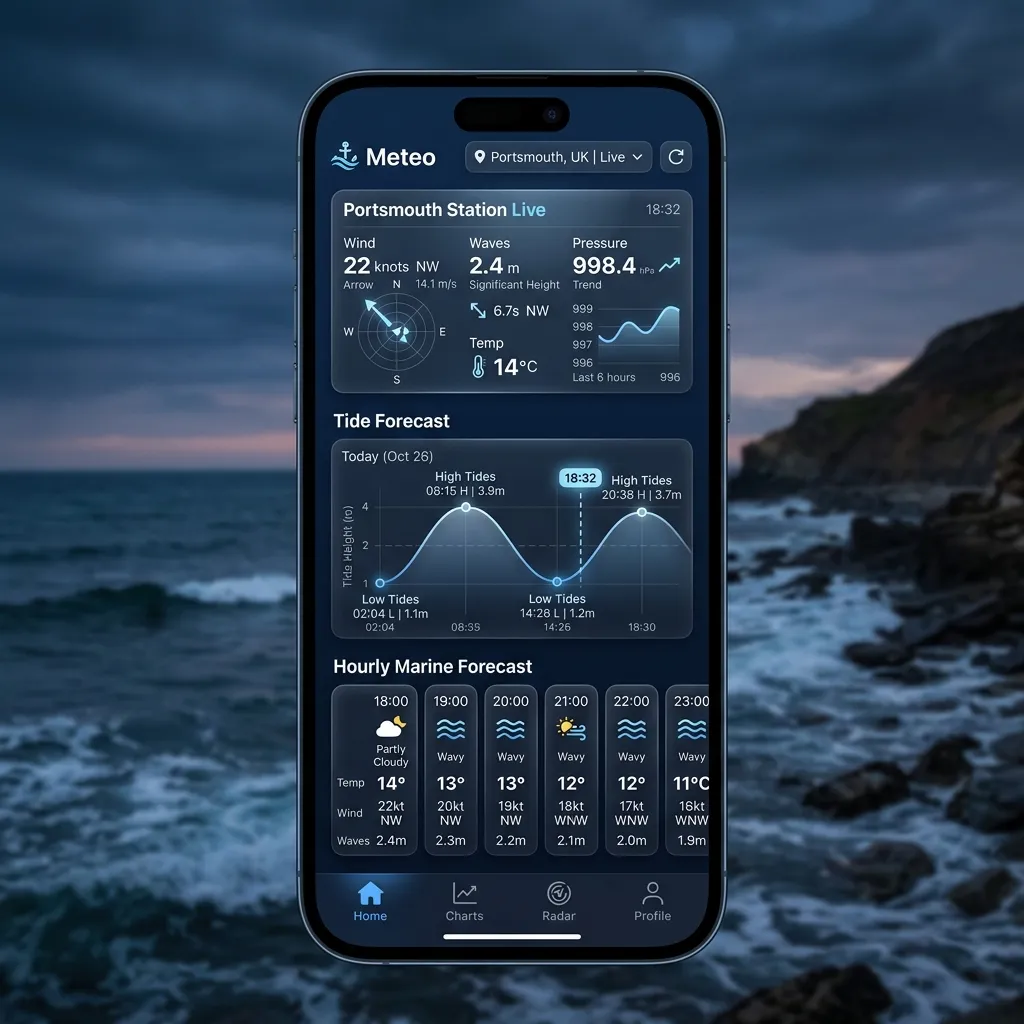
A live dashboard for the nearest station, or any station you save as a
favorite. At the top of the dashboard is a range picker
(12h · 24h · 3d · 7d); whatever you pick drives every chart and the
hourly carousel at once. This range picker is free — there is no Pro gate
on it.
Station card
The card headline shows your location (place and country). The source
weather/tide station is named just beneath it — that station is often
offshore or some distance away, so the headline tells you where the reading
actually applies, while the sub-line tells you which station it came from.
AIR, FEELS, SEA, and HUMIDITY, beside the current sky
icon and description.
the tides provider (NOAA or Stormglass), the weather provider
(Open-Meteo or Stormglass), a LIVE / CACHED badge, a PREDICTED
badge when the reading is filled in from forecast, and the vertical
datum (e.g. MLLW) when known.
to it in nautical miles, and the Lat / Lon the reading is for.
… button) — Refresh Forecast, ChangeStation, Save Station, and Show Map / Hide Map.
a centre crosshair shows the coordinate under the cross; tap Fetch
Data for This Location to pull the forecast for that exact point, not
just the fixed station pin. Your own vessel and the station are both
marked.
Charts and carousel
All of these follow the range picker.
follows the range you picked (12 h up to 7 days).
traces, Beaufort colouring, Strong-breeze (F6) and Gale (F8) reference
lines, a peak-gust marker, and wind-direction arrows along the top.
as rain / drizzle / snow / fog / thunderstorm, with a 50% "likely" line.
shows the value plus a small "sets toward" compass arrow.
1013 hPa standard line, a 1000 hPa "unsettled" line and shaded band,
ridge/low turn markers, and a 3-hour tendency badge — plus the current
visibility reading.
high/low waters, with labelled H/L markers, day/night shading, and a
live "Now" dot. A summary above it shows the next High, the live
Now height (with a Rising / Falling trend), and the next Low.
Every chart has a drag scrubber: drag across it and the readout above
the chart follows your finger; lift off to snap back to "Now".
Times and time zone
Every clock label in the Meteo tab — the hourly carousel, chart hours, day
separators, tide markers and the day/night weather icons — is shown in
your device's time zone, the same clock as the rest of the app. This
holds for saved weather pins and the live-map forecast panel too, so a pin
in another country reads in your time, not the pin's local time.
Before 2.4.2 these labels were drawn in UTC.
Where the readings come from
The Meteo tab pulls live marine data through AnchorQueen's backend, which
fetches per request and caches the result (the CACHED badge tells you
when you're seeing a cached pull). The providers:
NOAA's coverage zones; Stormglass elsewhere, and as a fallback when
NOAA can't be reached.
pressure, precipitation, waves, swell, and current; Stormglass as the
fallback.
forecast history shown in the Comfort detail sheet.
The tide curve you see is reconstructed from the high/low waters the
provider returns — AnchorQueen fills in the smooth shape between each high
and low (the analogue of the mariner's "rule of twelfths"), so you get a
continuous, scrubbable curve rather than just a list of times.
Events
At the top of the Events screen is a Comfort Meter — a ring showing a
one-glance comfort score for your current conditions, with the leading
factor named beside it (e.g. "Moderate Sea State", "+ 2 other factors").
Use it as the quick "is tonight workable" answer.
Tap the meter (or the chart button next to it) to open the Comfort
detail sheet, which plots your recent comfort history and the
forecast ahead so you can see whether conditions are improving or
deteriorating.
Below the meter is the list of active weather alerts for your area —
gale warnings, storm watches, small-craft advisories. Each alert shows its
severity and message, and is color-coded by severity (severe / moderate /
advisory). When nothing is active you'll see a "No active events" state
instead.
Live weather map
The Live segment (marked with a pulsing green dot) opens an animated,
online weather map: pick a field layer from the left rail — Temp, Rain,
Wind, Pressure, Radar — and add the Arrow (wind arrows) and Isobar
(pressure contours) overlays on top of any of them. The bottom timeline
plays or scrubs the multi-day forecast; a floating timestamp rides the
slider thumb.
the same map full-screen.
its hourly forecast panel — the same forecast grid used everywhere else
in the app — synced to the map's clock: scrubbing highlights the matching
hour, and tapping an hour seeks the map to it. Pull the panel down to
dismiss it.
saves a weather pin there and opens its report.
working offline from the last saved reports.
Meteogram
A separate, GFS-style graphical forecast in stacked panels, one variable
per row:
A current-conditions summary card sits on top, and — when the station has
marine data — a horizontal Marine Conditions strip below the panels
shows hourly wave height, direction, and period. Time runs along the
bottom; turn on the value inspector (crosshair) from the … menu, then
tap or drag to read exact values at any time. The same menu lets you save or
share the meteogram as a PDF or image.
Time-range filter & plan tiers
Above the panels is a time-range filter — 6h · 12h · 24h · 3d · 7d.
Unlike the Marine Weather range picker, this filter is Pro-gated above
the free tiers:
24 hours.
On a Free plan the 3d and 7d buttons show a lock; tapping either opens
the Store so you can upgrade.
Where the data comes from
The providers behind Marine Weather, Events, and the Meteogram are listed
above under [Where the readings come from](#oceanographic-engine); the full
partner list is in
Settings → Data Sources & Partners.
Reading the weather for a decision
Weather is the single biggest safety factor at sea. A few ways to use these
screens to make a go / no-go call:
wind panel), look for a stretch where both the wind line and the gust
trace sit below your comfort limit. The Strong-breeze (F6) and Gale (F8)
reference lines tell you at a glance when it's getting serious.
tendency badge ("Falling quickly", "Falling very rapidly") and the
shaded sub-1000 hPa band flag an approaching front or squall.
pass, read the height, and add it to the charted sounding depth. If the
chart shows 1.8 m and the tide reads +0.6 m, you have 2.4 m of water —
subtract your draft for the margin. Heights are relative to the station's
datum (e.g. MLLW), shown on the station card.
low tide — to avoid the strongest current. The Sea State card's current
"sets-toward" arrow shows which way it's running.
Moderate or Rough comfort score means conditions that will challenge a
novice crew.
Merconi, look for low wave height and an offshore wind
(blowing land-to-sea) for the flattest, clearest water.
If something goes wrong
Open the … menu and Change Station to pick a saved one, or open the
station map and Fetch Data for This Location somewhere nearer the
coast.
response for this station; try Refresh Forecast from the … menu.
last values are shown until you reconnect. See
Troubleshooting: offline behavior.
Meteo time was drawn in UTC. Update to 2.4.2; see
[Times and time zone](#times).