
 Anchor Alarm
SeaTracker chart — Route, Discover, Voyage
The SeaTracker tab is the nautical chart at the heart of AnchorQueen. The
chart never goes away — when you switch tabs and come back, your zoom and
position are exactly where you left them.
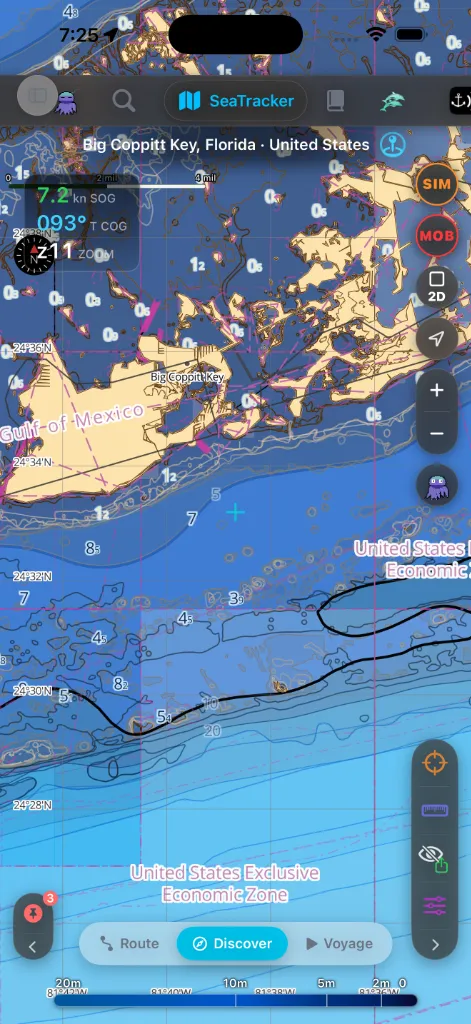
The bottom of the chart has a pill bar with three sub-modes:
Route — Discover — Voyage.
Discover
The default mode. The chart is yours to wander.
through compact and expanded states. It shows live motion, chart scale,
position, crosshair range/depth, instrument state, and the Signal K boat.
See Basic UI — the GPS HUD for the complete guide.
"23 dive sites · 8 wrecks · 4 harbours", counted for the patch of sea on
screen and updated as you pan. Tap a count to open the legend that lists
those items. When a layer is on but the water is empty, the strip says so and
tells you what to do about it — "No dive sites in this area — pan wider."
Dismiss the guidance line with its ✕; it returns for the next area.
just these two: Refresh Data re-asks for the exploration layers over the
current view (useful after a slow connection), and Browse Results
opens the content rail's categories again.
one badged cell per layer — buoys, seamarks, harbours, anchorages, dangers,
wrecks, light sectors, AIS vessels, fish species, dive sites, fishing watch,
ocean data, Wikipedia articles, your own captain's marks, and your
past anchorages — plus the
depth legend, which moved there off the bottom of the chart.
count bubble at passage-planning zooms instead of piling on top of each
other. Tap the bubble — or simply zoom in — to expand it into individual
icons. A lone harbour in an empty bay always shows as its own icon.
articles gather into one violet count bubble; zoom in and they spread into
individual pins, with titles appearing once you are close enough for them
to be legible. When two pins compete for the same spot, the richer article
(one with a photo and summary) wins — the chart never stacks labels on top
of each other.
fastest vessel in each area rather than an unreadable pile; zoom in past
mid-range and every received vessel appears. Vessel name tags appear
once you are close enough for them to be legible. Moving vessels glide
smoothly between position reports. Anchored or moored vessels are drawn
with their ground tackle: a red anchor point ahead of the bow, a line
running back to the vessel, and a lit anchor light — so you can tell at a
glance who is lying to an anchor and roughly where their anchor is. Vessels
whose identity carries a recognisable registry fly that country's flag at
the stern, turning with the hull. Tap any vessel for its details.
trails foam astern — a short curl at slow speed, a long spreading V at
passage speed. It is drawn from the ship's reported speed and heading, not
from where it has been, so it appears the moment a vessel gets under way and
disappears the moment it anchors. Your own boat leaves one too. It is the
fastest way to read a crowded anchorage: everything with foam behind it is
moving.
category's panel beside the content rail in landscape, or as a bottom sheet
in portrait; tapping another category replaces it. Each panel keeps its
tinted header with the layer's icon, name and live count badge, and a
✕ that turns the layer off. Cards no longer float free over the chart,
so nothing overlaps and there is no stack to dig through.
edge pocket behind the rail's ••• cell.
shows the depth under the crosshair as you pan.
as a dashed line — handy for crossing traffic. It is a layer you can toggle
(on by default) under Chart Layers → Navigation, where you can also set
its colour and line style.
the course predictor and heading ruler) can be switched off and on with
the double-circle cell on the command rail,
with the crosshair and ruler — useful when you want an uncluttered view of
the chart under your boat.
radial command menu fans out around your finger: Captain's Mark
(label and save the spot), Fetch Weather (pin the location and save
its weather report — see
[weather pins](#weather-pins-chart)), and Plan Route (jump straight
into Route mode with the first waypoint dropped). Tap a command to run
it, or tap anywhere else to dismiss. In Voyage mode the same gesture
offers Sail to Here and Fetch Weather; in Route mode it drops
the waypoint directly, no menu.
name, where it is, and the distance and bearing from your boat, then three
instruments chosen for what the object is: an anchorage shows the water under
your keel, tonight's wind and your anchor scope; a marina or harbour shows the
approach depth against your draft, the VHF channel and the berth count; a
light, buoy or beacon shows its character, its range and the bearing to steer.
A dash means the chart or the forecast has nothing there. On-the-water objects
— buoys and seamarks, harbours and marinas, dive spots and reefs, marine-life
sightings —
carry a Save as Waypoint action (the labelled pin in the card's top bar)
that drops a named, editable waypoint at that spot. Shore facilities such as
dive centres are not navigable points, so they omit it — you can still
bookmark them with a Captain's Mark or fetch their weather.
(the Fly-by 3D tab beside the Scene, and Full-screen fly-by in the
card's ⋯ menu) that opens a cinematic view of the mark on real elevation terrain:
the camera slowly circles the light, buoy or anchorage from the air, the
way a film establishes a location. Drag to steer the circle yourself,
pinch to move closer or further, or switch to the free camera and fly
anywhere — the slow orbit resumes a few seconds after you let go. The same
base-map picker as the passage replay is on board, satellite imagery
included. Above the mark's name sit the AnchorQueen icon and name, so a
screenshot of the flight says where it came from. (The button appears
when the 3D terrain service is enabled.)
seamark's details shows a short looping clip of a real fly-over instead of
describing one, with a Try it once, free button beneath it. The first
fly-over you start in an app session — from that button, from the
Fly-by 3D tab, or from Full-screen fly-by in the ⋯ menu — plays
in full with no preview countdown. After that, those places open the Pro
sheet until you next launch the app. Pro, Max, and captains whose chart
pack covers the mark are never limited.
header glides the chart to put the mark in the centre at your current
zoom. On the iPad floating card you can also resize from the top-left
corner, not only the bottom-right.
as a floating panel at full size over a live chart — every zone visible at
once. Drag the grab bar at its top to move it, drag the corner grip at the
bottom right to resize it, and tap the header's – to tuck it down to its
name and instruments. Position and size are remembered. Turn the iPad
sideways and the card slides into the side column; turn it back and it
floats again. On iPhone the card is a sheet, as before.
Use Discover to learn an area, scout an anchorage, or browse points of
interest.
The AIS Vessels panel
Tap the AIS Vessels cell on the
content rail (the ferry icon) to open the traffic
list for whatever is currently on screen. It opens like every other legend —
beside the rail in landscape, as a sheet in portrait — and replaces whichever
panel was open before.
What each row tells you
drawing you see on the chart, so the list and the chart speak the same
language. Anchored vessels show their ground-tackle symbol here too.
the flag of its registry, worked out from the MMSI itself.
badge for anything unusual about the ship's status — Anchored, Moored,
Aground, Fishing, NUC (not under command), RAM (restricted in its
ability to manoeuvre), or SART (a distress beacon).
old, so a stale contact never looks live.
CPA — how close will it pass?
When AnchorQueen has your own position, every row also carries a CPA
badge: how close that ship will come if you both hold your present course and
speed, and how many minutes until it happens. This is the number that matters
in traffic — a ship twelve miles away closing fast is more your problem than
one two miles away that is opening.
is tinted, and an AIS-SART always counts as red.
The badge is left out entirely when the ship is already drawing away, or when
your own position is not yet known — AnchorQueen would rather show nothing
than a made-up number. CPA assumes nobody alters course; it is a warning to
look up, not a substitute for looking out of the window.
Sorting and filtering
The chips across the top reorder the list by Risk (the default — closest
CPA first), Range, Speed or Name. The funnel button filters by
vessel type, so you can watch commercial traffic and ignore the weekend
pleasure fleet. The eye button hides or shows AIS on the chart; if the layer
is off, the panel says so and offers a one-tap Show.
Tap a row to open the vessel's full details, or the crosshair on the right to
centre the chart on it.
Vessel details
The sheet opens with the ship as the chart draws it: the hull for its type,
turned to its heading inside a compass rose, trailing foam when it is making
way and showing its ground tackle when it is at anchor. Under it sit the
vessel's name, its flag — the ensign and the country's name, both, because
several flags are hard to tell apart at a glance — and a badge saying what the
vessel is doing: under way on engine, under sail, at anchor, fishing, aground,
with its speed alongside. Contacts that broadcast no navigational status, which
is most small craft, get Making way or Not making way from their speed
rather than no badge at all.
Below that is what the ship broadcasts about itself — MMSI, IMO, call
sign, position, motion, dimensions, destination — plus a Registry section
that looks the vessel up in an independent record: year built, builder, gross
tonnage, owner and operator, home port, and a photograph where one exists.
Everything a ship transmits over AIS is typed in by its own crew, and it is
often stale or simply wrong. Where the registered name differs from the
broadcast name, both are shown — the disagreement is worth knowing about.
Many small craft appear in no public registry at all; the sheet says so
plainly rather than leaving the section blank.
Where a ship's registry keeps its name in its own writing system — Chinese,
Korean — that name is shown alongside the romanised one. Some records also
state the AIS class: a Class B transponder transmits less often and at
lower power than Class A, which is worth knowing before you lean on the
position of a contact that has not updated recently.
Registry data is compiled from open government sources — Wikidata, NOAA
MarineCadastre, France's ANFR, the EU Fleet Register, Finland's Traficom,
Taiwan's Maritime and Port Bureau and Korea's Ministry of Oceans and
Fisheries. Each record credits the sources it was built from, and photographs
carry their own individual licences, shown beneath the image.
Live instrument readout
If you have connected an NMEA instrument source (a Wi-Fi gateway,
Bluetooth pod, or Signal K server — see [Settings →
NMEA](settings.html#instruments)), the GPS HUD grows a live instrument section.
It appears only while a source is connected; on a built-in-GPS device the HUD
is unchanged.
RETRY (amber), or NO SIGNAL (red) — the transport (TCP / UDP / BLE),
and how long ago the last data arrived. The age keeps counting up if the feed
goes quiet, so a frozen "12s ago" is your cue the gateway stopped sending.
water shoals), wind (apparent or true speed with its angle), and — when
you tap the card to expand it — heading, speed through water,
sea temperature, and CUR. The tiles wrap into rows on narrow screens,
and only the values your instruments actually send appear.
speed through the water and a heading, AnchorQueen subtracts the water vector
from the ground vector and shows what is left: the set (the direction the
current is flowing towards) and the drift (its rate in knots). It is the
difference between an ETA that holds and one that slips by an hour, and no
single instrument reports it. It appears only when both vectors are present,
and stays hidden below 0.2 kn, where the answer would be calibration error
rather than tide.
Trend graphs
Expanding the GPS HUD reveals a row of trend graphs that scroll as new
readings arrive. Each one carries its own scale so it reads as an instrument
rather than a decoration: the live value sits at the top right, the window's
low and high sit underneath, and where it means something a small arrow gives
the rate of change.
metres per minute. The rate turns amber when the seabed is coming up.
This is the number that tells you a bank is rising under you before the depth
itself looks alarming.
building or a gust cycle before it reaches you.
The speed graph does not need instruments. If no Signal K server is
connected — or the link drops mid-passage — it keeps drawing from your device's
own GPS fix, and a small tag beside the title says which feed you are looking
at: SK for the boat's log, GPS for the handset. The trace is
deliberately not cleared when the link changes hands, because your speed over
ground does not change when the boat's Wi-Fi does.
The speed graph also appears in Voyage mode, below the position chip, where
"are we holding our planned speed?" is the live question.
Your fleet on the HUD — REMOTE
When you are in a Remote channel — a private
channel or a flotilla — the GPS HUD grows a second link section directly below
the instruments, marked RMT. It speaks the same language as the instrument
row above it, and like that row it appears only when a channel is joined: if
you never use Remote, the HUD is exactly as it always was.
(green), LINK… (amber, joining or reconnecting), QUIET (yellow —
you are in the channel, but nobody has sent a fix recently), followed by the
channel name and its type, and a ticking "last fix" age that turns amber past
10 seconds. Connected and talking are not the same claim, and the HUD
keeps them apart.
Each chip carries the boat's photo inside its status ring — teal at
anchor, indigo under way, red dragging, grey offline — a corner badge, the
name, and the live distance from you. The ring colours match the
chart fleet strip and the halos on the chart,
so the same boat never looks like two different boats.
boat sprite turned to its heading, name and status, live coordinate, and a
motion line reading HDG · SOG · BATT · YOU↔BOAT. Tap that row and the
chart flies to the boat at your current zoom. Tap the selected chip again to
go back to ALL.
summary — how many are live, anchored, under way, dragging — and tapping it
frames the whole channel on the chart with the connection web drawn in.
channel reports a dragging anchor, whichever vessel you had selected. Tap it
and that boat is selected and on screen in one move.
Expand the card (tap it a second time) and the REMOTE section adds value
tiles and actions:
(amber below 30 %, red below 15 — a watched boat whose phone dies stops
reporting drift at all), the FIX age, and RADIUS when the boat is on
anchor watch. In ALL mode the tiles count the fleet instead.
boat re-centres the chart on it. It stands down on its own if that boat goes
quiet, and whenever you select a different vessel.
live metrics), the same sheet the fleet board uses.
every anchored member's. In a crowded anchorage twenty overlapping swing
circles are unreadable; this is how you answer "is that boat still sitting
in its circle?". Available when the boat is on anchor watch, and it releases
when you change selection or collapse the card.
On the collapsed rail the section shrinks to a single RMT·n chip beside
the instrument chip, where n is how many boats are currently live. It is teal
while the channel is healthy, amber while joining, grey when everyone has gone
quiet — and red with a ⚠ while any boat is dragging, so the alarm survives
collapsing the card.
Satellite & Hybrid Base Map
You can overlay high-resolution satellite imagery directly under your vector nautical chart layers to get a complete photographic and metric view of coastal waters.
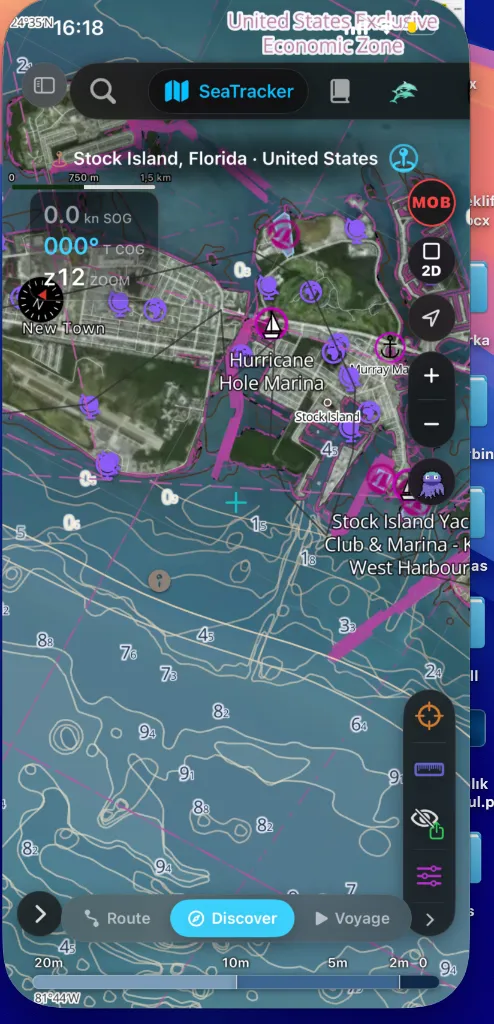
To enable this:
This overlays high-precision soundings and depth hazard lines directly over real-world coastal structures, making it extremely easy to plan entrance channels to unfamiliar marinas (such as the Hurricane Hole Marina in Stock Island, Florida).
Route
Route mode replaces the HUD with the Route Panel at the bottom.
Entering Route mode lands on your Saved Routes — never on a route already
opened for editing. Nothing is selected until you pick it, so the panel opens
as a list you read, not a plan you are already changing. Tap the Route tab
again at any time to open the full routes library.
The chart in Route mode shows your plans only. Recorded passages step
aside, so a planning canvas is never buried under last month's tracks; you
will find them in [Voyage](#voyage), which is scoped to them. Selecting a
passage from the Passages filter below still draws it, on demand.
Passages are part of your account, not of one phone. A passage you record
here is mirrored to your other devices and to Poseidon Web as a passage, with
its track; one recorded elsewhere lands here under the Passages filter
and replays like your own. Renaming follows it across devices, and deleting
it removes it everywhere on the next sync.
The list itself opens on Routes, and an All / Routes / Passages filter
above it keeps planned routes and recorded passages apart (the viewport count
follows the filter). Beneath it, Latest / Longest quick chips re-sort the
list in one tap — newest first, or biggest passage first — and widen it to
your whole library, whatever the chart is showing, until tapped again
(the count line then reads across all charts). Choose
Passages and the list becomes a captain's timesheet: recordings are sorted
newest first, grouped under their real sailing day (Today or a localised
calendar date), and each line aligns its departure and arrival times beside
distance and elapsed time. The grouping uses the first recorded GPS fix, so
importing or saving a passage later does not move it to the wrong day. Replay,
locate and chart-visibility commands stay on every line, and route rows carry
their created date beside their distance — in your chosen units — and
waypoint count. The locate button
always flies the chart to the route's or passage's start position — a
nameplate at that first fix shows its name and dates, so a berth shared by
several departures still reads unambiguously. Planned routes add an orange
SIM chip: one tap starts Simulator Mode with that route pre-selected —
the simulated vessel drops at the start and the autopilot sails the route at
its planned speed, while the panel tucks away to its R button so the
chart is clear to watch. Selecting
a route focuses the chart on it: if it was hidden it turns visible, and
every other route steps aside until you deselect — only a route you are
actively navigating always stays on the chart. Start
from a known voyage, or begin a new one right from the header row. NEW
ROUTE opens the departure dock picker: your favourites first, then
harbours, marinas and anchorages, then everywhere else — search by name, or
pick from the list of the nearest harbours it opens on. Choose a departure and
the destination picker opens by itself; choose a destination and the app
routes between the two around the shallows. That is a dock-to-dock passage in
a search and two taps. Beside it, Routes opens the full library and the
pin button drops the first waypoint at the chart centre for free-form
planning — the same thing a long-press on the chart does. Inside the planning
panel, the location button on the departure (A) slot fills it with your
live GPS position — the coordinates appear in the slot, a brief confirmation
flashes, and the panel moves on to the arrival (B) step by itself a moment
later.
Command Rail sits on the left edge in Route mode. Tap Drop DEP and
the chart waits for you — a banner reads *"Tap the chart to place
departure…"*. Tap (or press and hold) where you want it and the departure
lands there with a ripple. Tap the lit command again, or the ✕ on the banner,
to cancel without placing anything.
rail lights Drop ARR and the banner changes to *"Tap the chart to place
arrival…"* — one command press per point, never two. Your next tap sets the
arrival and the passage plans itself.
behind its R button, placing a point brings it straight back up — with
the point's place name, the coordinates and the running distance. Planning
a passage is a conversation with the boat, and you should never have to go
and find the answer.
icons; drag it sideways (grab it anywhere — the small pill on its right
edge shows where) and it widens to show each command's name. It remembers
which way you left it.
offers Drop DEP / Drop ARR. Once one endpoint lands, only the missing
endpoint and Clear remain. A complete editable route offers Add
Waypoint / Reverse. Recorded passages and routes already under live
guidance are read-only, so the editing rail steps away entirely instead of
offering actions that cannot apply. A passage is measured data: you can
open it, rename it and replay it, but nothing the planning surface does
can write a simplified line back over the fixes your boat recorded. Saved-route browsing stays in the
Route Panel (or its minimized R button), and every plan saves itself
as you build it.
fill in as points land, and the ringed one is the step the rail is waiting
on.
exist, Add Waypoint carries the route on to wherever you tap next:
the new point becomes the arrival, the old one becomes a via-point along
the way, and only the leg you just created is planned — the water
you already approved behind you is left exactly as it was. The command
stays armed, so a four-leg passage is four taps, each costing one
leg's work rather than a re-plan of the whole route.
route is selected (and not yet under edit), an Edit Route row leads
the list — the explicit way into an edit session. One tap frames the
route and drops a drag handle on every point. Recorded passages never
offer it: they are measured data.
under edit the rail grows a second group below a hairline: ✓
confirm, undo, redo, ✕ cancel (which restores the route
exactly as you opened it), and 🗑 delete. They sit under the commands
that built the route rather than on the opposite edge of the chart. Add
Waypoint stays live while editing and works on the route under edit:
arm it, tap the chart, and the new point is stitched into the nearest leg
— already a handle, ready to drag — while a tap beyond the arrival
extends the passage instead. Reverse flips the route under edit the
same way; each action is one undo step.
notice rather than silently making a route you can't sail.
capsule, the arrival as a red ARR capsule, and every via-point as a
numbered cyan circle — the number is the leg it closes. Re-dropping an
endpoint slides it to its new spot instead of jumping, so you can see
what moved.
Clear appears only while a one-ended draft still needs an escape path.
route has two points it is written to the boat's database, and every change
after that updates it — so a plan you were interrupted halfway through is
still there when you come back, and it survives closing the app. Deleting is
the deliberate act: the 🗑 on the rail while editing, or a swipe in the
Captain's Library.
recorded passage drawn on the chart is tappable — touch the line and it is
selected, the panel opens on its details, and its distance, timings and
waypoints are right there. No need to find its row in the list first. Marks,
vessels and harbours sitting on top of a line still win the tap.
three cells: under-keel clearance, ETA, and distance. The
clearance is the headline — the charted least depth along your route, plus
the predicted tide at the time you will actually be there, minus your
vessel's draft (from the Vessel profile). It reads green when the clearance
meets your safety margin, amber below it, and red at zero or less. The
distance cell shows the route total while you plan and the distance to
go while you navigate; while a route is still solving, the cluster shows
the solve progress and the distance routed so far. If the planner had to
relax its rules to find a way through — shallow-water routing, a best-effort
pass, or crossing a traffic separation scheme — a small amber flag sits
under the clearance and stays there after planning finishes.
action pills is gone; at the bottom of the panel sits a single wide button
that changes with the moment. While a route is solving it reads Solving ·
N % and waits. A freshly solved route without a departure time reads
Set Departure — tap it and the panel takes you straight to the
departure picker (the forecast and tide load from that time). With a
departure set it becomes Navigate, which does the whole set-up in one
press: the route is saved, guidance starts on the leg nearest your boat
(not blindly at leg 1, so the cross-track error is measured against the leg
you are actually sailing), and the camera follows the vessel. While
guidance runs it turns red and reads Stop Guidance. There is no other
start/stop control anywhere on the panel.
line narrates the same moment in words — "Routing leg B → C…" while the
planner works, *"Set the departure time — forecast and tide load with
it." when that is the next step, "Ready. Navigate starts guidance on the
leg nearest your vessel."* once it is, and while you navigate it switches
to an amber steering readout: the course to steer (with a small arrow for
which side of the track you are on), your cross-track error, the next
waypoint with its distance, and the time you will reach it.
gone; Auto Route now sits at the top of the panel's ⋯ menu,
alongside Details, Export PDF and Delete Route. Delete Route on a
selected saved route removes it from your library for good — it names the
route and asks first, exactly like the command rail's delete. On a route you
are still drawing it discards the draft instead, and says how many unsaved
waypoints that is.
always in landscape), the old waypoint slot list is a timeline: a
magenta rail down the left with a lettered pin for every stop you placed
(A, B, C…), each row showing the stop's name, its arrival time on the
right (from your departure time and planned speed — an em dash until a
departure is set), and a small course · distance line beneath. The
dozens of small points the auto-router adds between stops fold into one
"+N leg points" row — tap it to expand them (numbered hollow pins,
each with its own course, distance and arrival time), tap again to fold.
The leg that crosses the route's shallowest spot carries a small
amber depth flag on its arrival row. Rows still work like the old slots:
tap one to fly the chart there (while navigating, tapping a later stop
retargets guidance to it), and press-and-hold for replace / use vessel
position / focus / remove. The Free-form / Dock to Dock switch sits
in the timeline's header row.
button. Tap it and three quick-add actions fan out over a softened veil:
Waypoint (opens destination search for the next slot), Anchor (drops
an anchorage marker into the next slot or at chart centre), and Dock
(fills the slot with the nearest harbour from the maritime index). A brief
toast at the top of the panel confirms where the point landed. Tap ✕ (or
anywhere on the veil) to close the fan.
✕ deselects it and returns to Saved Routes without deleting anything;
Minimize parks the same selection behind the R button.
»30 m) for ocean trenches, so deep water never squishes critical coastal shallows into an unreadable band. A dashed red line marks your vessel's safety clearance depth, and an interactive floating readout shows depth, distance along the route, and predicted ETA as you scrub.Edit Route on the Command Rail. Opening a route for editing flies
the camera to frame the whole route first.
instant a point lands it is labelled with the nearest named place — a bay, a
town, or the sea area when you are well offshore — with no network needed.
A route you don't name yourself is called "Departure → Destination" once
both ends exist, and "area · date" before that, so a half-finished plan
is still recognisable in the library. A short hop that starts and finishes in
the same place is named for that place and the date rather than repeating it
("Türkbükü · 13 Aug", not "Türkbükü → Türkbükü"). Very long place names are
shortened at a word break so the title stays on one line — a name you type
yourself is never shortened, and never overwritten.
Route planning needs the depth data from a chart region, so it only works
over water a chart pack covers. If none does, the panel tells you so and
offers the download — see
[When no chart region covers this water](#no-chart-region).
Hybrid A*-APF & Relaxation Cascade
The routing engine operates off the main thread to ensure absolute UI responsiveness, resolving paths in three logical stages:
* Strict Mode: Enforces full draft + safety clearance along the entire route.
* Shallow Mode: If Strict fails, the planner relaxes clearance rules near the endpoints while warning you of potential draft exposure.
* Best-Effort Mode: Relaxes clearance limits entirely near docks to guarantee that a continuous route is generated, rather than aborting with a routing error.
S-52 Chart Standards & Cross-Track Distance (XTD)

SeaTracker adheres to IHO S-52 specifications for ECDIS chart display and IEC 61174 operational standards for route monitoring, giving captains professional-grade visual clarity and safety assurance.
Polyline Color Conventions
#DC299E / #FF00FF): The international standard token for planned routes. Planned passages created by the captain always render in solid magenta so they stand out clearly against bathymetric depth contours and seamarks.#FF2E91): Routes planned or suggested by Jules (your AI crew member) are rendered in a distinct hot-pink line, letting you instantly distinguish AI-authored passages from your own.#9AA0A6 / Speed Gradient): Past tracks recorded during active navigation render in neutral grey or speed-gradient colors (green → yellow → red), visually separating where you have sailed from where you plan to sail.[2, 2] Dashed Lines): Straight-line chains without a computed depth-aware path appear as dashed ghost lines so un-routed chords are never mistaken for validated passages.Waypoint details — tap to reveal
Waypoints along a displayed route render as numbered magenta circles
that keep the chart readable at every zoom; the selected one gains a
glowing ring in its role colour. Tap a waypoint to open its detail
card, connected to the pin by a thin leader line. The card speaks the
bridge's language — WPT, BRG, LEG, DTG, TTG, ETA — and shows what
matters for the leg at hand: incoming bearing and leg distance,
distance-to-go against the total, time-to-go at planned speed, the
wall-clock ETA when a departure time is set, wave and gust at the
waypoint's ETA when route weather is loaded, and a flip-over coordinates
panel.
chart and stays tethered to its waypoint by the leader line — pan or
zoom and it moves with its pin, holding the spot you gave it. Selecting
another waypoint snaps it back to automatic placement.
tick from your actual speed over ground and position, and the
current target waypoint carries a NEXT badge. Standing still, the
card falls back to planned-speed figures, dimmed and labelled as such.
track and the card shows FIX n/N — the wall-clock time you passed
it, your recorded SOG and heading there, distance covered and time
elapsed — never planned-speed arithmetic. A ▶ Replay from here row
on the card starts the [passage replay](#passage-replay) playing from
that very fix.
Exactly one card is open at a time: tapping another waypoint moves it,
and tapping open water — or any other chart object — dismisses it.
Stepping waypoints with the ‹ › arrows in the navigation HUD moves
the card in step.
Cross-Track Distance (XTD) Safety Corridor
Per IEC 61174 §8.2, planned routes display a Cross-Track Distance (XTD) safety corridor around the route line:
[6, 5] dash pattern) marking the outer boundaries of the XTD corridor ($185\text{ m} \approx 0.1\text{ NM}$ by default, customizable per route).Thin-Water Hazard & Tide Warnings
Each leg of a planned route is dynamically evaluated against vessel draft and predicted tide levels:
#F23030): Grounding danger — effective tide-corrected water depth is less than your vessel's draft.#FFA61A): Caution — water depth is less than your draft plus minimum safety clearance.Dock to Dock
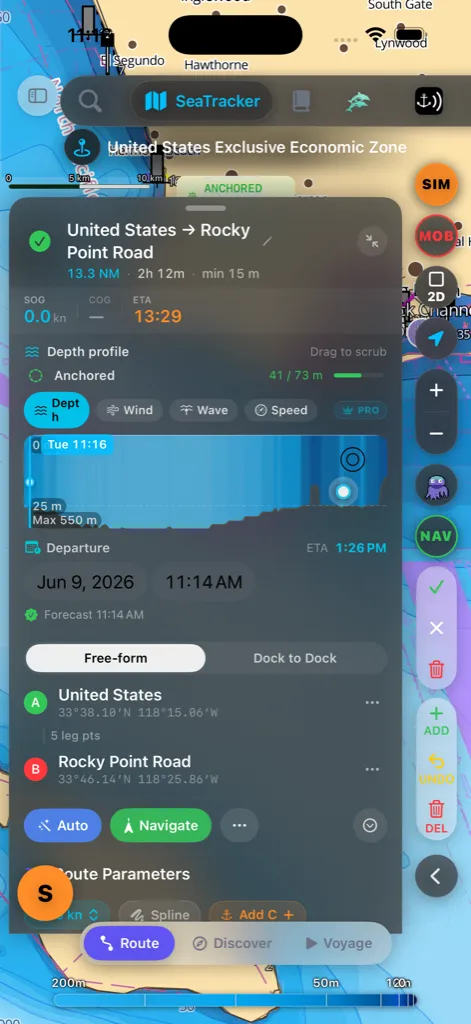
A two-way switch picks how you build the route — in Free-form it sits in
the voyage timeline's header row; in Dock to Dock it sits above the two
dock slots:
many anchors as you like; the app routes between each pair, and the
panel lists them as the voyage timeline described above.
harbour to that harbour" passage.
In Dock to Dock the panel shows two slots:
by name. You can also tap the location icon to use your current
position, or the ferry icon to drop in the nearest harbour.
A is set. The moment you choose a departure, the destination picker
opens automatically so you can search straight for where you are going.
The picker lists your favourites first (nearest to the chart centre at
the top), then harbours & marinas, with other places below, and shows the
distance from your current view for every row. Once both docks are set the app
auto-routes between them around the shallows, just like Free-form.
NEW ROUTE on the Saved Routes screen starts here: it switches to Dock to
Dock and opens the departure picker straight away.
confirm the pick — departure (A) recenters the view just like
destination (B).
departure and destination — the route re-plans instantly.
Renting a boat for the leg
If a dock slot lands on a harbour or marina where our charter partner has
boats, a small Rent from (harbour) ▸ chip appears under that slot's
coordinates:
departure date (the next Saturday if you have not set one) and return
either seven nights later or at your estimated arrival, whichever is
further out — a two-week passage asks for a two-week charter.
the next leg ▸ and opens on the first Saturday after you arrive. Charters
are picked up and returned at the same base, so B is an offer to start your
next voyage from there, never to drop a boat off.
connector. Tap the ✕ on it and it will not come back for that route.
slot really is a charter base, they never appear while the anchor alarm is
sounding, a drift warning is up, or you are making way at more than 2
knots, and they disappear by themselves if a watch fires while the panel is
open. What happens after the tap is described under
[Renting a boat here](#charter-rentals).
Captain's Library
The Capt's Routes entry in the side menu opens the Captain's Library —
one searchable place to manage everything you have saved or collected:
editor; swipe to delete. Long-press for the full action menu: View on
Map, Start Navigation, Duplicate, Reverse Direction,
Export GPX, and Passage Plan (PDF) — the printable A4 passage
plan, straight from the list, no detail sheet required.
and anchorage dwell time; the scope button flies the chart to it.
swipe to delete.
(distance, duration, track points). Tap one for the full passage log
with stats and the ETA calculator. The ▶ Replay button on a passage
row plays the voyage back on the chart — see
[Replaying a passage](#passage-replay).
A search box, sort menu, and live result count sit above the list. The
⋯ Advanced menu adds Import GPX and Manage Folders.
Importing a GPX file. Pick the file and the import runs in the
background behind a small Importing GPX card that counts the points as
they are read, then the routes as they are built. A long recorded track can
hold tens of thousands of points, so the counter is there to show the app is
working rather than stuck — wait for the card to disappear. The same card
appears when you import a GPX into the route planner.
In landscape the library opens in the right details panel, so you can
manage routes while the chart stays in view; in portrait it opens as a
sheet.
Telling routes and passages apart. Wherever a list can contain both
planned routes and recorded passages — the base-route picker when creating
a passage plan, and the available-routes panel on the chart — a small
All / Routes / Passages filter sits above the list, and it remembers
your choice. Search results in the command palette label each entry
Route or Passage so the two never blur together.
Replaying a passage
A recorded passage isn't just a line on the chart — it carries everything
the boat actually did: position, speed over ground, and heading,
fix by fix, on the real clock. Replay plays that voyage back on the
chart with your own vessel symbol.
▶ Replay button on any passage row in the
[Captain's Library](#captains-library), the passage's own detail page,
the saved-routes list on the chart, a passage found through
[search](#search), or the daily report in the Captain's Log — days with
a recorded passage offer to replay it. However you start it, the chart
flies to the passage start and loads the voyage paused at the first
fix — press play when you're ready.
symbol (not the translucent planning ghost) and turns with the heading
you actually steered. The symbol matches the class on your
boat card — a catamaran replays as a catamaran, a tender as
a tender — using the same modelled hulls the 3D replay flies. The recorded passage is coloured segment by segment
from blue through cyan, green, yellow and orange according to recorded
speed. A fading trail follows it, showing the last couple of minutes of
replayed track in the same speed colours. Ahead of the boat, the part of
the passage still to come shows as a white dashed line whose dashes march
toward the destination — the same "not yet" language the route planner
uses.
HDG, the wind you actually had — value, gust and a direction
needle — depth under the cursor where chart data allows, the wall-clock
time at the current position, and elapsed / remaining time for the
passage. Wind is sampled quietly while a passage records (from your
instruments' true wind when connected, otherwise the live forecast), so
passages recorded before this version show a dash there.
so you can switch mid-replay, from the flat chart straight into the flight —
or Replay in 3D on a passage's detail page before you start. Either opens
a separate, full-screen surface that flies the passage over real terrain
instead of drawing it on the flat chart. The camera rides astern and above
the boat the way the Vision viewport does, the coast and islands stand up in
relief around you, and the track paints in the same speed colours with a
marker at every turn you made. A speed scale down the left edge carries a
live marker at your speed at that instant; the scrubber doubles as a profile
of the whole passage. Playback runs at 10×, 60× or 240×.
You fly behind your own boat. The 3D vessel matches the type on your
boat card — sailboat, motor yacht, catamaran, trimaran or
tender — and is scaled to her real length overall, so a 16 m cat and an
8 m tender read differently in the same flight. Under the passage title a
small crew card names the flight: the captain with their profile
photo, and the vessel with her name and photo, straight from your Captain
profile and boat card. No boat card yet? The replay sails a sloop and the
crew card stays out of the way.
This is a picture of the passage, not a chart — the terrain is land
elevation, the water is not surveyed depth, and nothing on it is for
navigation. It needs a connection.
Who can fly. The 3D replay is open with Pro or Max — or with a
chart subscription that covers the waters the passage sails, on any
plan. Without either, a short free preview may play before the flight
pauses and offers both ways in: the plan, or that region's chart.
The flight opens over satellite imagery with place labels — the base
map that makes real terrain read as real coast. The base-map button still
offers the whole set, and your pick is remembered on this device for the
next flight.
Fly a different hull. The vessel button in the camera cluster lets you
swap the 3D boat on the spot — My boat follows your boat card, or pick
any of the five hull classes. Cosmetic only: the crew card keeps telling
the truth about your boat, and the choice sticks on this device.
The frame is signed. The AnchorQueen icon and name sit above the
passage title — the same small bug the seamark fly-over carries. These
are the screens that get recorded and shared, and the picture should
travel with the app it came from.
the readouts — the same 3-D view live navigation draws, fed from the scrub
cursor instead of your GPS. It shows the water ahead of the boat *as it was
at that moment in the passage*, with your track streaming out astern in
speed colour and your boat drawn as your real vessel. It follows the
scrubber: play, drag or jump the cursor and the view moves with it, at the
speed the boat was making. Tap to walk the camera round the boat, drag to
orbit, double-tap to return to the chase view. Off by default — it is a tall
block on a phone that also has to show the scrubber.
rail. The rail keeps SOG, HDG, replay time, Follow and Close within
reach while the scrubber continues to show progress below. Tap the up
chevron to restore wind, depth and the detailed passage clock. If you do
not interact with it, the deck folds itself after a few seconds; your own
size choice is never overridden. Close asks Leave replay? with explicit
Stay and Leave replay actions; staying returns you to the same replay
position.
(1×–256×) scale the recorded clock — the replay slows where you
actually slowed and runs where you actually ran, so a lull at anchor or
a fast reach reads exactly as it happened.
in [Voyage](#voyage) — drag to any point of the passage, tap play from
there.
boat, course-up. Pan the chart and the camera is yours again, just like
live navigation.
Voyage
Voyage is active navigation. A single press-and-hold turns a spot on the
chart into a planned passage you then choose to start. Until you've sailed
a few voyages, an on-chart hint reminds you of the gesture.
your finger; hold until it completes.
from your current position (A) to that point (B) around shallows and
land. Tap the pill's ✕ to abandon the plan. If something prevents a
route — no GPS fix, a destination on land, a point too close to the
boat — the pill says so right there.
the distance and estimated time, and the planned path draws on the
chart as a dashed preview line — pan and zoom freely to inspect it.
The chart frames the whole plan above the voyage deck so nothing —
the vessel, either endpoint, or the line — hides behind the panel; if
your finger is still on the chart, the framing waits for your gesture
to settle.
(your track, waypoint arrivals, and stats) start, the depth and weather
graphs fill in, and nearby chart objects drop at both ends. Tap
Dismiss to discard the planned route; nothing is started or saved.
Navigation quick commands. The round button in the right-hand column
fans out Voyage's own command set: Anchor (drop or lift the anchor
watch), My Vessel (drop your vessel pin), Course Up (turn the chart
so your heading points up the screen, instead of north), and Follow
Vessel (keep the camera on the boat; tap again to let the chart stay
where you leave it). The last two light up while they are engaged. These
commands appear in Voyage only — Route and Discover have their own sets.
Because you confirm with Start, a stray long-press never launches a
voyage on its own. Both endpoints are named after their nearest place. If
the boat has moved meaningfully while the card sat waiting, tapping
Start quietly re-plans from where you actually are before navigation
begins, so the route always starts at the bow — not where it was a few
minutes ago.
Already navigating? A press-and-hold while a voyage is running doesn't
start a new one — it proposes inserting a waypoint at that spot and
reroutes from your current position through it, pending your confirmation.
The passage timeline
Your recorded passages on a time rail, the same one SafeAnchor →
History uses for anchorages. Tap Passage
Timeline on the Voyage command rail (the clock glyph) and the rail stands on
the left edge of the chart: newest at the top, a hairline and label at
every year, the spine solid through months you sailed in and dashed through
the gaps, a dot on each sailing month sized by its passages — a busy season
thickens into a bar instead. The sailboat is the cursor; the chip beside
it reads the date under your thumb.
passage with a light tick. Each one is selected as you pass: its track
draws on the chart, the chart frames it clear of the rail, and the
[passage deck](#passage-deck) comes up with Replay and the Bridge Deck.
seconds. Any drag or calendar tap stops it.
narrows the rail, the chart's selection and the Passages list together
(the list shows the window as a chip with an ✕). A day selects that day's
passage. All time clears it.
Tap the cell again to put the rail away; the choice is remembered. The rail
hides on its own while a passage replays, while the Bridge Deck is expanded,
and in clean export.
The selected passage deck
Entering Voyage with a recorded passage on the chart — the app adopts your
latest recording automatically, and picking one from the Passages list
selects it too — brings up a slim passage bar at the bottom, above the
mode pills. It names the passage, shows its distance and elapsed time, and
carries four buttons: the viewfinder flies the chart to the passage —
the quick way to find a selection that is somewhere off the water you are
looking at — ⋯ opens the passage menu (below), ⌃ opens the full
deck, and ✕ deselects the passage and clears it from the chart (the
same action as the rail's Dismiss Passage command), so a selection you
didn't ask for is gone in one tap.
Drag or tap the bar to raise the passage deck — a dark instrument sheet
in the same style as the Route Panel. The half sheet shows the instrument
cluster (distance, duration, average speed) and a REPLAY
button that hands the passage straight to the
[replay deck](#passage-replay); pull higher for the speed profile of
the whole track (with your average marked as a dashed line) and the log
facts — top speed and the number of GPS fixes. The header's viewfinder
button frames the passage on the chart — in the part of the chart the
raised deck leaves visible, so the track never lands behind the sheet —
and ✕ deselects it from any height. While the deck is raised the mode pills step aside, exactly as they
do for the Route Panel, and they return the moment the deck drops back to
the slim bar.
Renaming a passage. Tap the passage's name in the deck header and type
a new one; Return (or tapping elsewhere) saves it. The new name follows the
passage to your other devices.
The passage menu (⋯). The same menu sits on the slim bar and in the
deck header, and it carries the passage's secondary actions — the same set
Poseidon offers on Android:
time, speed and course, so it opens as a passage on another AnchorQueen
device and as a track in any chart plotter.
passage: it appears in the Passages list, on the timeline, and can be
replayed. A track with no timestamps is imported with times estimated at
6 kn and says so in its notes. Waypoint-only files are routes, not
passages — import those from the Route tab's library instead.
device and from every device signed in to your account; it cannot be
undone.
In landscape the deck docks as a right-hand column with the same content.
Active navigation is untouched by any of this — the
[Guidance HUD](#active-nav-hud) keeps its own card at the top of the chart.
Active Navigation HUD
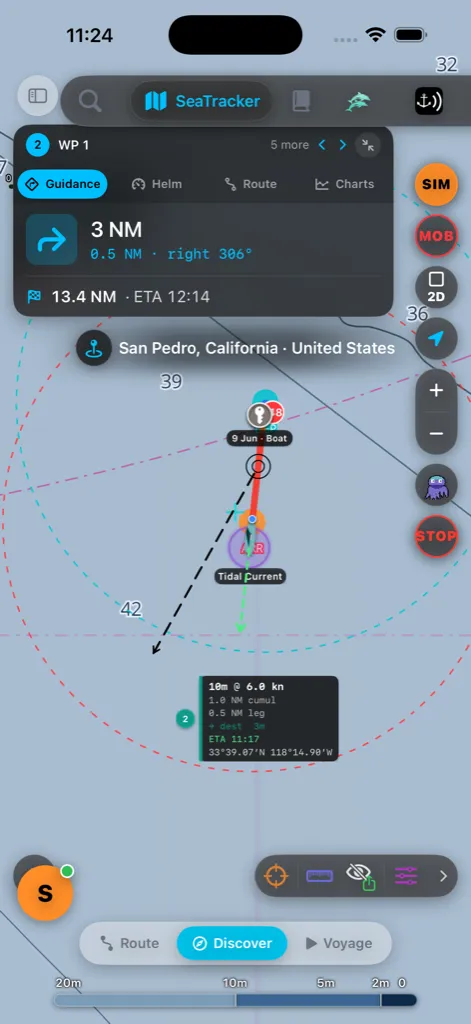
While navigating, one card sits at the top of the chart with five
tap-to-switch sections:
a cross-track error bar.
remaining, and your position in the route.
ribbon, shallow patches, nearby traffic, and roughly the last 200 m of
your own track streaming out astern in speed colour (cool where you were
slow, warm where you were making way). The camera follows from above and
behind, so a turn you have just made is visible behind the boat. Tap to
walk the camera round the boat, drag to orbit, double-tap to return to the
chase view.
Your boat and every AIS contact are drawn as three-dimensional vessels
seen from the camera's own angle, not as flat plan symbols — a container
ship carries its stacks, a tanker its deck manifold, a yacht its rig, and
each turns to show its real heading as it manoeuvres. Your own boat uses
the vessel type set in your boat profile, so what you see
under the bow is your boat. Contacts pressing on the corridor keep their
own outline but pick up an amber or red wash and a ring, so a close
ship is still recognisably a ship. Moving vessels trail a wake that spreads
aft across the water.
type buttons to switch which graph is shown. Depth is always free; the
Wind, Waves, and Tide forecast graphs are a Pro feature — on a
Free account those strips show a locked "Pro feature" upsell instead of a
curve. See the Store to unlock them. Wind draws gust as a
fainter dashed line over the wind line, with wind-direction arrows. Each
graph shows live forecast data along the route, waypoint marks, and a
distance scale. A white dot tracks your current position; drag the
graph to scrub a white dot along the route on the chart — it snaps back
to your live position after a moment. Tide shows the predicted
harbour tide height along your route, drawn around a mean-sea-level line
(the curve dips below the line at low water); where tide predictions
aren't available for an area the graph shows a gap rather than a guess.
Use the ‹ › arrows in the HUD header to step to the previous or next
waypoint; a short banner confirms the new target. The hide button
(⤡) in the HUD header collapses the whole card to a small NAV · WP
chip; tap the chip to bring it back. The place-name badge tucks in directly
beneath the HUD so the rest of the chart stays clear.
Two panel sizes
The pair of buttons next to hide sets how much of the screen the HUD
takes. Your choice is remembered between voyages.
card anywhere on the chart to park it where it suits your helm position;
double-tap it to snap back to its default place. Buttons, the graphs
and the Vision view keep working while it's draggable — only the card's
plain areas move it.
The turn, destination, bearing · distance · speed and cross-track
readouts are all on screen at once, next to one detail pane you choose
between Route, Charts and Vision. In Route the pane lists
the legs still ahead with distance and ETA for each — tap one to make it
your target. Drag the grabber on the band's bottom edge to set how
much chart the band covers; double-tap the grabber to restore the
default height.
In landscape the large band splits into two columns — readouts on the left,
the detail pane on the right — so the extra width goes to the graphs and the
Vision view rather than stretching the digits.
The command window at the bottom (depth scrubber + playback controls)
has three sizes — tap its stage button to cycle full → compact →
minimized and back, freeing chart space when you don't need it.
In landscape the small HUD is width-capped to the leading side so it never eats
the chart, and panels you open from it (route detail, passage plan) dock into
the right details column instead of covering the map — the same split behaviour
as the [Captain's Library](#captains-library).
Stopping & rerouting
reads STOP while you navigate. Tapping it asks you to confirm
before ending guidance, so a stray tap can't drop your route.
slides in showing the time and distance you would save. Tap Accept
reroute to switch or Keep current — it also dismisses itself after a
few seconds if you do nothing.
Automatic passage recording
You no longer have to remember to press REC. With Auto-record passages
at sea on — it is on by default — AnchorQueen watches how the boat is
actually moving and starts the passage recording itself.
When it starts. Every 30 seconds the app reads your position together
with the phone's motion sensors and decides what you are doing: sailing,
motoring, or simply making way at more than 2 knots. Two of those cycles in
a row underway — about a minute — with the fix on water and not on land, and
recording begins. It is the same recording the REC button starts: the
same track, the same statistics, the same place in the library afterwards.
and you sail out of the swing circle, that is departure enough — no need
to wait out the second cycle. This holds even if AnchorQueen was force-quit
at the mooring: iOS wakes the app as you cross the circle, and the
departure is honoured the moment it comes back.
actual position fixes have been collected and merged, so a recording never
announces itself over an empty track.
alone, and nothing auto-starts while you are already navigating a route —
that voyage brings its own recording with it. After you stop a recording
yourself, automatic recording stands down for a while, so the next fix
cannot immediately restart the passage you just chose to end.
The banner. Once the passage is genuinely under way, a card rises from
the bottom of the chart — Passage recording started, with the time it
began — and offers two choices:
the press-and-hold hint. Press and hold the water you are headed for, the
route plans itself, and Start on the Route ready card runs live
guidance on top of the recording that is already going — the track
continues underneath, unbroken.
While you are already navigating, the banner stays out of the way entirely.
Setting a destination later. You do not have to decide at the banner.
While a recording is running and no guidance is active, the
[Discover](#discover) long-press menu carries the same Set destination
command, so you can pick a destination an hour into the passage without
stopping or restarting anything.
Arrival saves it for you. When the boat has been at anchor or ashore for
about three minutes, the passage is over: the recording stops and saves
itself. It lands in the [Captain's Library](#captains-library) under the
Passages filter with its distance, duration and full track — ▶ Replay
included, see [Replaying a passage](#passage-replay) — and the ship's-log
voyage closes with its arrival entry, exactly as though you had stopped the
recording by hand.
Turn the whole behaviour off under Settings → Chart →
Measuring distance — the ruler
The Ruler cell on the command rail turns the chart
into an EBL/VRM bearing-and-range plotter. Distances follow your unit
preference; bearings are always three-digit degrees true.
Taking a measurement.
brings up the MEASURE banner with live BRG (bearing), RNG (range to
the crosshair) and Σ (running total).
the chart and use Drop to place it at the crosshair for a precise fix.
Keep going for as many legs as you need — B, C, D…
chart; DISMISS leaves the tool without saving.
A saved measurement stays on the chart as a dashed line with a lettered
vertex at every point, a per-leg L1 · 043°T · 1.24 NM label, and a Σ total
for multi-leg measurements. It survives closing the app.
Tap a saved measurement to work with it. Tapping the line — with the
ruler open or not — raises its panel at the bottom of the chart:
you can undo back to the point you want to move and re-drop it. The banner
shows an EDIT chip, the stored line is hidden while you work, and
Save rewrites that measurement instead of leaving a near-duplicate
beside it.
coordinates, bearing and leg distance — to Messages, Mail, WhatsApp, or
anywhere else iOS can share text.
Finding a place
Tap the search icon in the top bar to open the search panel. On iPhone
it opens as a full-screen search surface with the results filling the
display; on iPad it floats as a compact palette. It has two tabs:
What Map Search looks through
One search box queries everything at once and groups the results by where
they came from, your own data first:
| Group | What it finds | Where it comes from |
|---|---|---|
| Favourites ❤️ | Everything you have hearted — seamarks, routes, passages, marks, past anchorages — shown first, even with an empty box | On your device, synced to your account |
| Captain's Marks | Your saved pins, dive sites, and saved articles | On your device |
| Routes | Your saved routes (by name) | On your device |
| Waypoints | Your named waypoints | On your device |
| AIS Vessels | Live ships near you, by name, MMSI, call sign, type, or destination | Live AIS feed |
| Harbours | Marinas and harbours from the bundled database | On your device |
| Seamarks | Charted buoys, beacons, and lighthouses | On your device |
| Places | Bays, islands, towns, landmarks, addresses | OpenStreetMap (online) |
| Places (Google) | Marinas, businesses, and points of interest by name, where available | Google Places (online) |
| Harbours (Online) | The worldwide marina/port database — thousands of marinas with facilities, shelter, and approach depth | OpenSeaMap (online) |
| Explorations | Wikipedia articles about places near you | Wikipedia (online) |
Your own data and live AIS appear instantly as you type. The online
groups join a moment later — they start once you've typed three letters and
the app waits for a short pause in your typing before reaching out, so it
isn't firing off a request on every keystroke. Online results are cached,
so repeating a recent search returns instantly and still works when you later
go offline.
Reading a result
Each row shows the name, a short subtitle (vessel details, route length,
harbour facilities, and so on), and — when the app knows your position — the
distance in nautical miles. A small dashed-square icon means the place
has a known boundary, so flying to it frames the whole area rather than a
single point.
When a routing chart is installed for the area, each result also carries a
water verdict: a cyan waves icon means the spot is on navigable water
for your vessel; an orange mountains icon means it is inland (or too
shallow), so using it as a route endpoint will snap it to the nearest
coast. When you open search from a Route A/B slot, on-water results are
listed first within each group.
Tap a result (or its → button) to fly the chart there and drop a pin at
the spot, labelled with its name so the location stays marked after the
camera settles. Tap the pin to clear it. Tapping a route result reveals
that route and frames it end to end; tapping a Wikipedia result also opens
its article panel.
Every place result also carries a purple Route here button — one tap
starts a passage to it: the app switches to Route mode and sets the place as
the arrival, snapped to navigable water if it is inland. Your live position
fills the departure and the route plans immediately whenever the boat is
within coastal-passage range; otherwise the arrival stays put and the chart
asks you to tap a departure. The same Route here action is available on
harbour and seamark info cards and on article panels, so anything you can
look at, you can sail to.
Recent searches
When the box is empty the panel shows your Recent searches. Each row
carries a small badge showing who ran it:
to find somewhere, she searches the very same sources listed above, so a
marina she finds lands here ready to tap.
Tap the ✦ Jules chip above the list to show only the places Jules found.
Clear History wipes the recent list and the offline cache.
> All online sources are not for navigation and may be unavailable
> without a connection — your charts, marks, routes, and the bundled harbour
and seamark data always work offline.
Favourites ❤️
The places and passages you return to can wear a heart. Tap ♥ on:
anchorages, lights, buoys, any charted mark;
panels on the content rail;
star is now the heart);
passage detail page;
[Keeping a charter boat on the chart](#charter-favourites).
A favourite gets a small ❤️ badge beside its chart symbol that stays
visible at every zoom level and is never folded into a cluster — zoom out
to the whole sea and your hearts are still there. From mid-zoom the name sits
under the badge. Tap the badge to open the card (or reveal the route);
tap ♥ again anywhere to remove the favourite.
The badge is a dark disc with a coloured ring, and the ring says what you
hearted: teal for a charted seamark, indigo for a planned route,
cyan for a recorded passage, amber for a Captain's Mark, green
for a past anchorage. It reads the same on a night chart, on a paper-style
day chart and over satellite imagery. Hearted charter boats are the one
exception — they get the boat itself rather than a badge, see
[Keeping a charter boat on the chart](#charter-favourites).
To get to one quickly, open [Search](#search): your favourites are listed
above Recent with an empty box, and typing filters them by name or kind.
Tap a favourite and the chart flies there on an arc, zooming in to harbour
scale if it was further out, and lands with a heart pulse on the spot. The
Route here button on the row plans a passage to it like any other result.
Favourites are part of your library: they sync with your account like your
marks and routes, so a heart added on one device appears on the others, and
removing it anywhere removes it everywhere. They are kept on the device and
work offline.
Choosing the chart style
The base-map style and depth palette live in the chart itself — open the
Chart Layers sheet from the bottom-right corner and pick them under the
Maps tab (see [Chart Layers](#layers)). The choice is global and persists
across launches. A fresh install opens on the OpenStreetMap base map, so
land, towns, and coastlines are visible worldwide before you download
anything; the moment your first chart pack finishes installing — including
the free worldwide base map — the app switches once to Nautica Day (with
the reverse NOAA palette), the style tuned for day-time clarity at anchor.
Pick any base map yourself and that choice sticks: the automatic switch
never overrides an explicit selection. The only
chart-appearance control in Settings is the
Auto-match Device Appearance toggle, which flips the palette between its
day and night siblings when iOS switches light/dark mode — it does not choose
the base map.
Chart Layers panel
The Chart Layers sheet is where every overlay is switched on or off. It is
organized into five tabs across the top so you jump straight to what you want
instead of scrolling one long list:
Night, Dusk (the official S-52 twilight colour table), and
Paper (the traditional paper-chart look) — plus third-party providers),
the depth-palette theme, the Depth & Bathymetry group (Depth Contours
and Depth Polygons are on by default so a fresh install opens to a legible
bathymetry chart; the heavier Water Depths / EMODnet fill stays off until you
switch it on, and changing the chart theme re-shows the contours and polygons
if you had hidden them), and
the vector base-map sub-layers (roads, buildings, labels, POIs, boundaries).
Start here to set how the chart looks.
(seamarks, administrative regions, [traffic separation schemes](#tss),
customs, raster charts) and the offline S-57 ENC stack you unlock by
installing a region (soundings, channels, hazards, seabed).
Country borders and maritime zones (EEZ) have no switch — they are
always drawn as overview context and disappear on their own once you zoom
past harbour-approach scale, so they never sit on top of chart symbology
where it matters.
seamarks, harbour database, weather, and the exploration layers
(marine life, dive sites, ocean data). The Global Fishing Watch effort
heatmap is not listed here — it lives in the Merconi tab's
Fishing lens and has no separate Layer-Control switch.
AIS API feed (aisstream.io / VesselAPI) with provider and connection
status, and the Fleet (Remote Sync) group — captains sharing live
position through a SafeAnchor remote channel, with a brief showing the
channel name and how many vessels are synced. The feed always starts each
launch on the default aisstream.io provider; VesselAPI is used only as
an automatic failover (if aisstream.io stays unreachable) or when you pick
it yourself, and that choice lasts for the session only — the next launch
returns to aisstream.io. When you pan or zoom, the ships already on screen
stay put while the feed re-subscribes to the new area in the background —
they refresh in place rather than blinking off and back on. If the feed
provider goes down at its end, AnchorQueen retries for a couple of minutes,
then stops and shows Live AIS Unavailable in the vessel list rather than
retrying forever in your pocket. It tries again on its own about ten minutes
later, and if you have VesselAPI configured the feed fails over to it within
half a minute. The ships last seen fade off the chart as they go stale rather
than sitting there looking live. Charted objects, your own tracks, and the
anchor watch are unaffected; only live ship traffic pauses.
Your own AIS key — an optional field under the provider row lets you
connect with an aisstream.io account of your own instead of the shared
built-in one; see [Using your own AIS key](#ais-own-key).
How traffic is reaching you — the provider row carries a badge showing
the connection in use: Shared connection (green) when the traffic comes
through AnchorQueen's own connection, shared by the whole fleet, or Direct
connection when this iPhone is connected to aisstream.io itself. You don't
pick this and you don't need to act on it; the app chooses per session and
falls back on its own. When there is something you can do — the shared key
is full, or signing in would get you the shared connection — the badge turns
amber and a line underneath says so. Full explanation in
AIS tab for live positions of other AnchorQueen captains broadcasting on
the public beacon near where you're looking. They show on the chart with
an amber ring (so you can tell them apart from your own flotilla,
which is teal, and from raw AIS, which has no ring) and update live while
you're zoomed in. A brief shows how many are in view. It starts off
because keeping the live feed open uses data — turn it on when you want to
see who's anchored around a busy bay.
line, anchor history) plus the appearance of the anchor-watch rings,
own-ship lines, and per-mode crosshair colours.
The bolt menu in the top-left corner has Show All Layers and
Hide All Seamarks shortcuts, reachable from any tab.
Using your own AIS key
Live vessel traffic comes from aisstream.io, a free public AIS service.
AnchorQueen connects to it with one key built into the app — the same key for
every copy of AnchorQueen afloat. aisstream.io allows only three
connections per account at a time, so that shared key is always close to
full: when its three slots are taken, the service refuses new connections and
no ships appear.
An aisstream.io account of your own — free, no payment details — gives you
three connections nobody else is using. This is entirely optional. Leave
it alone and AIS keeps working on the built-in key whenever a slot is free.
What you need. A GitHub account: aisstream.io has no sign-up form of
its own and signs you in with GitHub only. If you don't have one, create it
first at github.com — free, an e-mail address and a password.
To get a key
GitHub shows you.
masks it afterwards. If you lose it, create another one from the same
page.
To use it in AnchorQueen
until you add one — or Shared key full, in amber, when the built-in key
is the reason traffic has stopped. Get a free key at aisstream.io
opens the site if you still need one.
reconnects straight away.
The row then reads Yours ···· with the last four characters of your key,
so you can tell at a glance which key is in use. Remove key and use the
shared one puts everything back the way it was.
Three connections, and where they go. Every device that uses your key
takes one of your three connections — an iPhone and an iPad on the same key
use two. Don't hand the key to the crew: the fourth boat is refused, and it
may be yours. aisstream.io is also slow to notice a connection that ended
without saying goodbye, so a phone that died mid-stream can hold a slot for a
long while. AnchorQueen releases its connection properly whenever you leave
the app or switch AIS off, so your own slots come back the moment you look
away — but if the panel ever reads your key is full, close AnchorQueen on
your other devices and wait a little before trying again.
Where the key is kept. In this iPhone's Keychain, and nowhere else. It
never leaves the device, is never sent to AnchorQueen or anyone else, is not
carried in an iCloud backup, and does not follow you to another iPhone — set
it up again there if you want it on both. Uninstalling the app removes it.
Soundings — depth numbers on the chart
Installed regions print spot depths (soundings) the way a real chart does:
an integer with a smaller tenths digit beside it (5₄ means 5.4 m). Numbers
shallower than your draft plus safety margin (from your
boat profile) are drawn in the warning colour so the depths
that could ground you read at a glance.
The Charts tab → Soundings group controls how they appear:
spaces them the way an ECDIS does: roomy at passage-planning zoom, dense
while piloting, and depths safely beyond your draft step back into a quiet
grey so the shallow digits stand out. Pick Sparse, Balanced, or
Dense instead if you prefer one fixed spacing at every zoom.
contour labels (Day Bright, White Back, Black Back, Dusk, Night, or a
custom colour). Auto follows the active base map and depth theme.
Anchorages, marinas & harbours
Anchorages and marinas are the places you actually sail to, so the chart
gives them front-row treatment:
glyphs, drawn larger than ordinary buoys and beacons, and they stay legible
from passage-planning zoom instead of appearing only when you're almost on
top of them. Names appear beneath the symbols from mid-zoom — no more
tapping every anchor to find out which bay it marks.
facilities collapse into a single harbour badge with a count. Tap it to zoom
in and spread them out.
(not just a point), the chart shades its extent with a translucent tint and
a dashed boundary once you zoom to harbour scale — you can see exactly where
the designated anchorage begins and ends. Tap inside the area for details.
plus the OpenSeaMap harbour database, which also powers
[Map Search](#search) results for harbour names and links to community
pilot-book pages where available.
Marinas and Harbours under the Charts tab's seamark group.
action: harbours, marinas, anchorages, all seamarks (lights, buoys,
beacons, wrecks, landmarks…), dive sites, ports of entry, and saved
waypoints. One tap pins the place as a
[weather pin](#weather-pins-chart), fetches its meteogram report, and saves
it for offline reading; the button then shows Weather Report Saved with
the report's age, and tapping it re-opens the saved report. This in-app
report is the only weather path on these sheets — the old external
OpenSeaMap meteogram link (online-only, left the app) has been retired.
Weather pins on the chart
Locations you pin for weather (from a POI detail sheet or the
Meteo tab's avatar strip) render as round weather
badges on the chart — the current sky glyph on a blue disc, with the pin's
name and a compact temperature · wind · age caption beneath. The badges
appear on every chart surface, including the SafeAnchor anchor-watch
chart, and update as reports refresh.
from the app's first fetch — shows as a My Position badge that moves
with your weather fetches, so the anchorage you're sitting in always has
an aged report on the chart. Remove it from its report sheet if you'd
rather not see it; the Meteo tab's + brings it back.
turns amber as the report ages and the whole badge greys out once it is
older than 12 h. The age in the caption counts up (35m, 3h, 2d).
alerts, and the full meteogram for that spot, plus Refresh / Remove.
is fetched while a saved report is still current, so pinned weather is
kind to your data plan.
Shore services on the chart
Zoom in to harbour scale and the shoreside places a crew actually needs —
fuel, a mechanic, a chandlery, a market, a pharmacy, the customs agent, the
waterfront restaurant — appear as small coloured discs along the shore,
each carrying the symbol for what it is. A green cart is provisions, an
amber pump is fuel, a red cross is a pharmacy, a steel spanner is a
mechanic. The symbol on the disc is the same one you see on the facility's
own card, so a place looks the same wherever you meet it.
so in a busy harbour you can pick out the chandlery from the café without
zooming further.
many people rated it, whether it is open now, and Call / Website buttons
where the place published them.
full of restaurant pins would bury the navigation marks.
Where they come from — and why a stretch of coast can be empty. These
come from Google Places, and the app looks them up when you open a
marina, harbour or anchorage card — not by sweeping the coastline as you
sail. So the discs appear around the places you have actually looked at,
and a bay whose card you have never opened shows none. Open its card once
and they arrive.
Once fetched they are stored on your device, so they stay on the chart
afterwards with no network — including offline, on the next passage, and
after a restart.
There is no layer switch for these. Gathering them needs Pro or Max
(the lookup is part of the same coastal intel that fills a mark's photos),
so on the Free plan the chart simply never collects any.
Renting a boat here
Tap a marina, harbour or anchorage and the card can carry a Yacht charter
section under the details. It appears only where our charter partner,
Boataround, actually has boats, and it is the one place in the app that opens
charter inventory — nothing is pushed at you while you are sailing.
Not only marinas. Cannes' Port de Moure Rouge is charted as a light,
and a card like that used to offer no charter content at all. Now every coastal
mark can answer a charter question — which question depends on the mark:
based here, and the section shows even when the answer is none.
… Limanı, Hafen …, Luka … — is treated as that harbour.
customs office, a wreck — answers for the place instead: *what can I
charter near here. The partner line then reads Charter near Cannes ·
Boataround, the list of bases is headed Charter marinas near Cannes*, and
the way out is Search Boataround for Cannes ▸. The Vessels tab reads
Vessels (6) · near Cannes. The week chips are there too, so you can change
your dates without leaving the card.
A "near a place" section appears only when there is actually something to
show — at least one boat or one charter base nearby. A lone buoy in an empty
bay shows nothing at all, and no boats are drawn on the chart around it: a
fleet belongs to its base, never to the mark you happened to tap.
What the section shows
opens a short note: who Boataround is, that booking happens on their site,
and that we may earn a commission. Read it once; it is the same disclosure
that ends this page.
and a Reserve button. Tap either the button or the banner and you leave
for Boataround's search for this place and your dates. If the promotion
ends, the discount simply disappears and the banner keeps working.
photo, the model and the price. Tap one to open it. The prices are the
partner's real list prices for that boat, so no discount badge sits beside
them — the promotion belongs to the banner above, not to any one boat.
Two prices, not one. Every boat now shows the nightly rate and, under it,
the week total for a Saturday-to-Saturday charter. The week is the
partner's own figure for a real week, never seven times the nightly average —
a charter week carries its own discounts, so multiplying would put a number on
screen that no checkout would honour. A boat the partner has not priced for a
whole week shows the nightly line alone.
What a boat's card tells you
Tap a boat — in the list, on the Vessels carousel or on the chart — and the
card is a full dossier, not a thumbnail with a price. Everything on it comes
from the charter listing itself; anything the operator has not filled in is
simply absent, so a short card means a thin listing, never a slow one.
the quoted price is a pre-tax one — Price excludes VAT, so the number on
the card and the number at checkout cannot surprise you.
based on. No score means no reviews yet.
partner's checkout will ask for — typically 25 %.
a dinghy with an outboard, an outside plotter, paddleboard, bed linen — plus
the crewed extras when the listing has them: skipper, chef,
hostess, transit log, fuel, deposit insurance. Chips that
Boataround itself includes are tinted.
the berth count, engine power and fuel type, fuel and water tank capacity in
your units, the rig, the build and refit years, and the flag she sails
under — the country matters when you cross a border mid-charter.
where the partner ranks it in its own country (Top 4 of 334 in Turkey).
That ranking is Boataround's, not ours.
Keeping a charter boat on the chart
Tap the ♥ on a boat's card or list row and that boat stays on your chart
until you remove it.
This is the same heart as the rest of [Favourites](#favourites): the boat joins
your hearted seamarks and routes, appears in [Search](#search) above Recent,
and syncs to your other devices. What makes it different from the boats a
marina card draws is that it does not expire. An ordinary charter fleet is
temporary — it clears when you close the card, and always when the anchor alarm
sounds. A hearted boat is your own bookmark and stays put.
On the chart a hearted boat is drawn as the boat, not as a heart on top of
something else: the same hull the marina's fleet uses, in the boat's own
category — catamaran, sailing yacht, motor yacht — with a small heart on its
bow quarter and its name underneath. A gulet is drawn as a sailing yacht,
which is the honest reading of the shapes we have.
Two things worth knowing:
charter boat never reports where it is, and nothing about it reaches AIS,
radar or collision alerts.
are kept on your device, so tapping the heart months later still opens the
card — even offline, and even if the partner has since taken the boat off
the market. Re-open it from a fresh search to refresh the price.
nothing is based here the section offers Search Boataround ▸ instead.
What the sheet shows
Power cat. Switching a chip re-asks for that category; the previous
answer stays cached, so switching back is instant.
nights, because charter weeks run Saturday to Saturday. Change either and
the list — and the link you leave with — follow the new window.
cabins · sleeps and a from price per night. Tap a row for the boat card:
the same detail larger, plus Rent on Boataround ▸.
they are based in, nearest first — "3 boats at Marina Kornati, 12 km" —
because charter boats lie in marinas, not in bays.
which opens the partner's own search for this area and your dates.
The Vessels tab. When boats are based here the card's scene zone grows a
Vessels (N) tab beside Photos. It is the photo carousel again, with
Boataround's own boat photography instead of Google's coastal pictures: one
full-width photo, a 1 / N counter, a small blue B for the source, and
the boat's model over the base it charters from (📍 marina, or the town
when the partner names no marina) over Photo by the charter company that
lets it — so a fleet gathered from several bases says which boat lies where
without opening a card. Swipe, or
tap the round ›, to move through the fleet; tap the photo to open that
boat's card. A row of quick filters sits above it — All · Catamaran ·
Sailing · Motor · Gulet — and it narrows the carousel and the boats on the
chart at once, instantly, without asking the partner again. The filter
resets when you close the card.
Boats on the chart. The moment a marina or anchorage card opens the app
quietly fetches the fleet, and up to six of its boats appear on the
chart — no extra tap — lined up side by side in a berth row beside the mark:
evenly spaced, all bows toward the quay, drawn with the very same hulls the
app uses for your own boat, each lying to its ground tackle the way a moored
vessel does and carrying a small blue B for the partner. Zoom in past
about z11 to see them; their model names and from prices join them a little
closer in. The six are picked one category at a time, so a base that keeps
catamarans, sailing yachts and a gulet shows you all three rather than six of
whichever happens to be nearest. The row is drawn, not surveyed — every one of
these boats lies alongside in the marina itself, so they are laid out in a
rank beside it to stay readable. Tap one for the same boat card the sheet
gives you.
The pins stay put. They are drawn on every plan, because they are part of the
place you tapped rather than an advert — one marina's boats at a time. They
remain on the chart after you close the card, until you open another marina or
clear them yourself; the app no longer retires them on a timer. The one thing
that still takes them away on its own is safety: they vanish the instant a
watch fires. Neutral Mode hides them entirely.
What it is not. A charter boat's position is its charter base — the
marina it is let from — never a live position. These boats are not AIS
traffic: they never appear on the radar, never enter a CPA/TCPA calculation
and never sit in the AIS vessel list. Tapping one on the chart opens a
charter card, never a vessel card.
From the route planner. The Dock to Dock slots carry the same offer for a
planned passage — see
[Renting a boat for the leg](#dock-to-dock-charter).
Safety comes first. The whole section and the sheet are suppressed
whenever the anchor alarm is sounding, a drift warning is up, or you are
making way at more than 2 knots — the section disappears mid-session if a
watch fires, and an open sheet closes itself.
Every Rent tap leaves the app for Boataround in Safari; booking, payment
and the charter contract are entirely between you and them. AnchorQueen earns
a commission on a completed booking, which is what keeps the free tier free.
Drawn to their real length. A 46-footer is no longer the same size on the
chart as a 38-footer beside it. Every charter hull is drawn from the boat's own
overall length, and how much of that difference you see depends on how far in
you are: from a distance the row is sized for legibility and the lengths are a
hint, while at berth zoom the boats settle to true scale — a 14 metre yacht
then measures 14 metres against the scale bar, so a rank of boats reads the way
it would from a drone. The berth row opens up to match, giving long boats room
between them, and the name and price tag lift clear as the hulls grow. A boat
whose length the partner never published is drawn at the fleet's middling size
rather than left off.
Lit hulls and price tags. Charter boats now glow: each hull sits on a soft, slowly breathing blue halo so the row reads as offers rather than as more traffic, and every priced boat carries a blue price tag floating above its bow — the per night amount in the currency the partner quoted, drawn so any currency sign shows correctly. The model name sits below the hull. Tap the tag or the hull to open the boat; the halo holds still when Reduce Motion is on.
The fleet lies to a pontoon. The rank is no longer floating in open water. It is moored to a Boataround Ponton — a pontoon drawn at its real size in the blue this chart already uses for harbour areas, with a finger pier between every pair of boats, a mooring pile at each finger head and a gangway back toward the shore. The deck sits ahead of the bows, so the boats read as lying bow-to a jetty rather than as pins on water. It appears with the boats and takes its name a little further in; nothing on it is tappable, so a finger never steals a tap from the boat moored to it.
The green boat at the head of the pontoon. One boat in the rank is not for hire: a small green launch with a shuffle mark where the charter hulls carry the partner's B, labelled with the boats you cannot see — + 12 more. Tap it and the row swaps for the next boats of the same fleet, a page at a time, wrapping back to the first when it runs out. Nothing is fetched — the whole fleet is already on your device — so the row changes in the same frame. Choosing a category or a week starts the pages again from the beginning, and a fleet small enough to fit on one row has no green boat at all.
The viewport and what sits under it
Drag the picture taller. Under the viewport is a short grip — on every
tab: Scene, Fly-by 3D, Photos and Vessels. Drag it down and the
picture grows — up to about seven tenths of the card — and drag it back up to
shrink it. The height stays where you left it for the rest of the session, and
it is the same height on every tab, so switching tabs never makes the card
jump. A card you reopen paints at the size you chose rather than snapping back.
VoiceOver can adjust it in steps.
What is below follows the tab you are on. The card no longer shows the same
stack under every tab:
week chips, every boat as a row with its price and availability, the other
charter marinas nearby, and the way out to Boataround.
dossier.
with the charter section under them.
The partner banner appears once, never twice: whichever of the two charter
views is on screen owns it.
The graph follows the charter, too. The card's small graph — Stay ·
Weather · Tide — opens on Weather, and once you have picked a charter week
it plots that whole week rather than tonight: pick +1 wk and the wind,
gusts, pressure and wave trace redraw from midnight on the check-in day and
run seven days, with the weekday on the hour axis so a multi-day window still
reads. Every week chip redraws it — Last Minute, +1 wk, +2 wk — and
the week then stays on the graph while you look at Photos, Scene or
Fly-by 3D and come back. Only picking a different week changes it. Weeks
further out than the forecast reaches fall back to the next 48 hours — we would
rather show you real weather for the wrong days than an empty graph for the
right ones. The graph is
also taller than it was, so the wind line, the gust band and the wave trace no
longer sit on top of each other.
Choosing a week
Above the boats — on the marina card's charter section as well as on the
Vessels tab and in the full sheet — is a row of weeks: Last Minute,
+1 wk, +2 wk, +3 wk, and Custom. Charter weeks run Saturday to
Saturday, so each chip is one of those. The app asks for all four weeks of
prices in a single request, so moving between the chips is instant and costs
nothing.
Custom opens two date pickers — Pick-up and Return — and they reach
a full year ahead, because a summer charter is usually booked in winter. A
Saturday to Saturday switch sits under them: leave it off for any dates you
like, turn it on and the pick-up snaps back to its Saturday and the return
lands a week later, which is how most of the partner's boats are priced. Unlike
the week chips, a custom range is a fresh question, so the app asks the partner
again for exactly those dates.
Each chip carries the number of boats free that week — "+2 wk · 7". A week
this base is fully booked shows · 0 and is dimmed rather than hidden, so you
can see at a glance where the gap is. The counts follow the category chips: ask
for catamarans and the weeks tell you about catamarans.
Picking a week narrows the list. Boats that are taken that week leave the
list and the chart, and what remains is sorted cheapest first for the week you
chose. If the partner has not priced this fleet at all, the chips carry no
counts and nothing is hidden — we say nothing rather than guess. When every boat
is booked for the week you picked, the list says No boats free that week and
the chips above are your way out.
Ordering the list. A small ⇅ Sort control sits at the end of the week chips: it orders the boats by Best match (the default), price low to high or high to low, top rated, or longest first — your choice carries across the charter section, the Vessels tab and the full sheet, and is remembered for next time. The pins on the chart keep their berth order.
Finding boats when the marina has no fleet
Not every harbour on the chart is a charter base, and a small bay almost never
is. When the name of the mark you tapped matches nothing in the partner's
catalogue, the app widens the question instead of giving up: it looks for bases
around the mark and for the town it sits in, and brings back whatever it
finds within about 25 km.
It happens by itself. You do not have to ask twice. When the exact search
for the mark comes back with no boats — a working harbour that is simply not a
charter base — the app searches again straight away, around the place's own
address: the town on the card's Address row. It tells you while it works
(Searching around Key Largo…) and heads what it finds with Boats near Key
Largo, so you always know the boats belong to the area rather than to the pin
you tapped. If that second search finds nothing either, the button at the foot
of the section becomes Search Boataround for Key Largo ▸ and takes you to
the partner's own results for that place rather than to their front page.
And once more, under the name of the city. Charter sites list towns, not
neighbourhoods: anchored off a district like Salacak, a search under that
name finds nothing while the same water is listed under Istanbul. So when the
search around the mark's address comes back empty as well, the app tries a third
time under the name of the city the mark belongs to, and heads what it finds
with Boats near Istanbul. Only the name widens — every boat still has to
lie near the mark you tapped, so a fleet moored far down the coast can never
appear on your card — and a place that stays empty keeps its own name in the
wording and in the Search Boataround for … ▸ button.
You can tell that happened because the section grows a Charter marinas near
place row — Other charter marinas nearby, when we could not put a name
to the place — each base with its distance and how many boats it holds. Tap one
and the chart re-centres on it and the sheet shows that base's boats. On the
chart the boats are drawn where they actually lie: a berth row at each base, up
to four bases at once, rather than all piled beside the mark you tapped.
Fetch charter around a mark
You do not have to wait for a card to offer boats. Open the ⊕ ring at the
bottom of any marina, harbour or anchorage card and pick Charter: the app
searches around that mark and puts what it finds on the chart.
These boats are pinned for three days. They survive closing the card and
quitting the app, and they are back on the chart the next time you open it — so
you can shortlist a bay on Monday and still see the fleet on Wednesday. Opening
another marina, or clearing the fleet, takes them away; so does a watch. Safety
removes them immediately, pinned or not.
Searching for a destination
The charter sheet's header carries a search field — Destination, marina,
city…. Type two letters or more and the partner's own places appear, each
tagged Marina, Destination, City, Country or Region, with
its distance from you. Pick one and the sheet re-asks for boats there while the
chart follows. Picking a marina asks that marina directly; picking anything
wider searches around it, the same way the ring does.
Your last category is remembered while the app is running, so moving from
marina to marina keeps the search you were making. The week goes further:
the dates you last searched are kept between launches, and every charter
surface opens on them — as long as they are still ahead of you. Once the window
you chose has passed, the app quietly falls back to Last Minute rather
than opening on last season.
What it costs, in your money. Under the blue B every boat photo now
carries that boat's price per night and for the whole week, exactly as
the partner quotes them — the week is never seven times the night, because
charter weeks carry their own discounts. Tap the currency code under the
prices to switch currency: the app asks the partner to price the fleet again,
and every amount you see is in the currency the partner actually quoted, so a
currency it does not carry simply stays in euros. Your choice is remembered,
and it starts on your own currency when Boataround supports it.
Traffic Separation Schemes (TSS)
In busy waters, shipping is funnelled through Traffic Separation Schemes —
one-way lanes for opposing streams of traffic, divided by a separation
zone you must keep out of. AnchorQueen carries the IMO/IHO scheme data
offline and draws it on the chart; the layer lives under Chart Layers →
Charts and is on by default, because the rules of the road
(COLREGS Rule 10) require you to treat these zones with care.
On the chart the lanes show the direction traffic runs; the separation
zone is the strip between opposing lanes.
While you are under way, AnchorQueen watches your track against any scheme you
are near and raises a banner:
way the lane runs before you commit.
Rule 10 says cross as near to a right angle as practicable — straighten
up toward 90°.
direction of flow, a Rule 10 violation. Alter course.
The banner is always shown on screen while an alarm is live; an OS
notification is also posted when the app is in the background. Anchoring is a
special case — Rule 10(g) forbids it inside a separation zone — and is handled
by the anchor watch, see
SafeAnchor → Anchored in a separation zone.
Turn the alarms off (the layer stays) under
Settings → Nav → Safety Alarms.
S-52 Chart Rendering & Local Vector Tiles
At its core, AnchorQueen uses a customized MapLibre GL Vector Compilation Engine designed to provide a highly interactive, 60fps chart experience entirely offline.
* S-52 Day, Dusk & Night Charts: Conforming to IHO (International Hydrographic Organization) Presentation Library standards, the app translates S-57 ENC feature attributes (depth contours, light sectors, buoys, restricted areas) dynamically using custom styling stylesheets (Nautica Day, Nautica Night, Nautica Dusk — the authentic S-52 Dusk colour table — and Nautica Paper, the traditional paper-chart presentation).
* Offline Vector MBTiles: Raw bathymetry, land outlines, and marine boundaries are compiled using optimized mathematical simplifications (tippecanoe) into highly compressed, local MBTiles packages (adminland.mbtiles, maritimezones.mbtiles, admin_places.mbtiles). This reduces resident storage from gigabytes of raw GeoJSON down to a few hundred megabytes, preventing out-of-memory crashes on mobile devices.
* Bundled SDF Glyphs: A fully offline Signed Distance Field (SDF) font package covers Latin, Cyrillic, Greek, and Turkish character sets, enabling real-time font rendering at any tilt and zoom angle.
* Keel Sounding Lookups: Tapping the crosshair triggers a local spatial Kd-Tree lookup to query soundings and physical hazards under the cursor. This operation runs off the main thread to prevent map stuttering during fast pans.
Recording a track
Open the Tracking sheet from the chart's action menu to start recording
a track. Tracks are saved as GPX files you can keep, share, or replay later
from Capt's Notebook.
Chart downloads for this area
The Charts cell (map icon, among the tools on the
command rail) is the chart's download scout and the health check for
the charts you already own. Tap it and a small panel lists what needs your
attention right now:
don't have it yet,
different one (planning a Caribbean season from an Aegean anchorage shows
both),
recommended first download. It paints survey-grade land and coastlines at
every zoom level worldwide, which is why the app nudges you toward it: on
a fresh install a small bubble appears next to the Charts button for a few
seconds ("Free world map available — tap to add") and then gets out of
your way,
chart covering the area is installed but its subscription has lapsed, and
covering chart has been published.
A chart you have installed, licensed, and up to date never appears — the
panel only ever shows actionable rows. Download rows show the region's name
and size; tapping any row (or Browse all charts) opens the
Store's Charts section, where downloads, renewals, and
updates all run.
The expired notice carries an inline Renew button — tap it and the
purchase sheet raises right there; the moment the renewal completes the
notice clears itself. (Tapping the rest of the row still opens the Store if
you'd rather browse first.)
The button pulses when something new needs attention — an uncovered
area, a lapsed subscription, or a fresh update. Opening the panel once
acknowledges it — the pulse stops and a small dot remains as a quiet
reminder. A chart moving into a new state (say, its subscription lapses
later) pulses again. In landscape the panel keeps a slimmer footprint and
its list scrolls, so it works the same either way you hold the device.
When a chart subscription expires
An expired chart is not taken off the screen — it keeps rendering for a
grace period so you are never left staring at blank water. What changes is
what you can do on it:
refuses with a "Chart subscription expired — renew in the Store" notice.
chart (unless another licensed chart also covers that water). The refusal
offers Renew directly.
routing engine keep working.
Renew from the [Charts button](#chart-downloads) (fastest), from the
refusal prompt, or in the Store.
When no chart region covers this water
Routing reads the depth grid that ships inside a chart region. Over water
no installed region covers — a fresh install, or a passage into a sea you
haven't bought yet — the app cannot plan a course at all, and it now says so
instead of doing nothing:
"No depth charts for this area — download a chart region to plan routes."
The banner carries a Get Charts button that opens the
as a pill at the bottom of the chart, also with Get Charts. It waits
for you — unlike ordinary warnings it does not fade after a few seconds,
because tapping it is the whole point.
notice, and raises the same banner in the panel.
"No depth charts for this area — tap to download" row for as long as no
depth grid is loaded.
Everything that does not need the routing engine keeps working over
uncovered water: the base map, your position, the anchor watch, pins,
tracks and passage recording.
Two related messages name the same fix:
but its depth pack is incomplete. Reinstall it from the Store.
usually an interrupted download. Reinstall it from the Store.
Both appear under the region's row in
Offline tiles
Open the Cache sheet from the chart's action menu to download a tile
pack for the area you are sailing. With a region installed from the
Store, the area becomes fully offline-capable.
If something goes wrong
or installed the matching region. See Store.
for your draft; nudge the point into deeper water and try again.
endpoints in deeper water.