Meteo — väder, tidvatten och varningar
Meteo-fliken samlar allt du behöver för att läsa havet innan du litar på det.
Ett segmentfält högst upp har tre avsnitt:
Marint väder — Händelser — Meteogram.
Marint väder
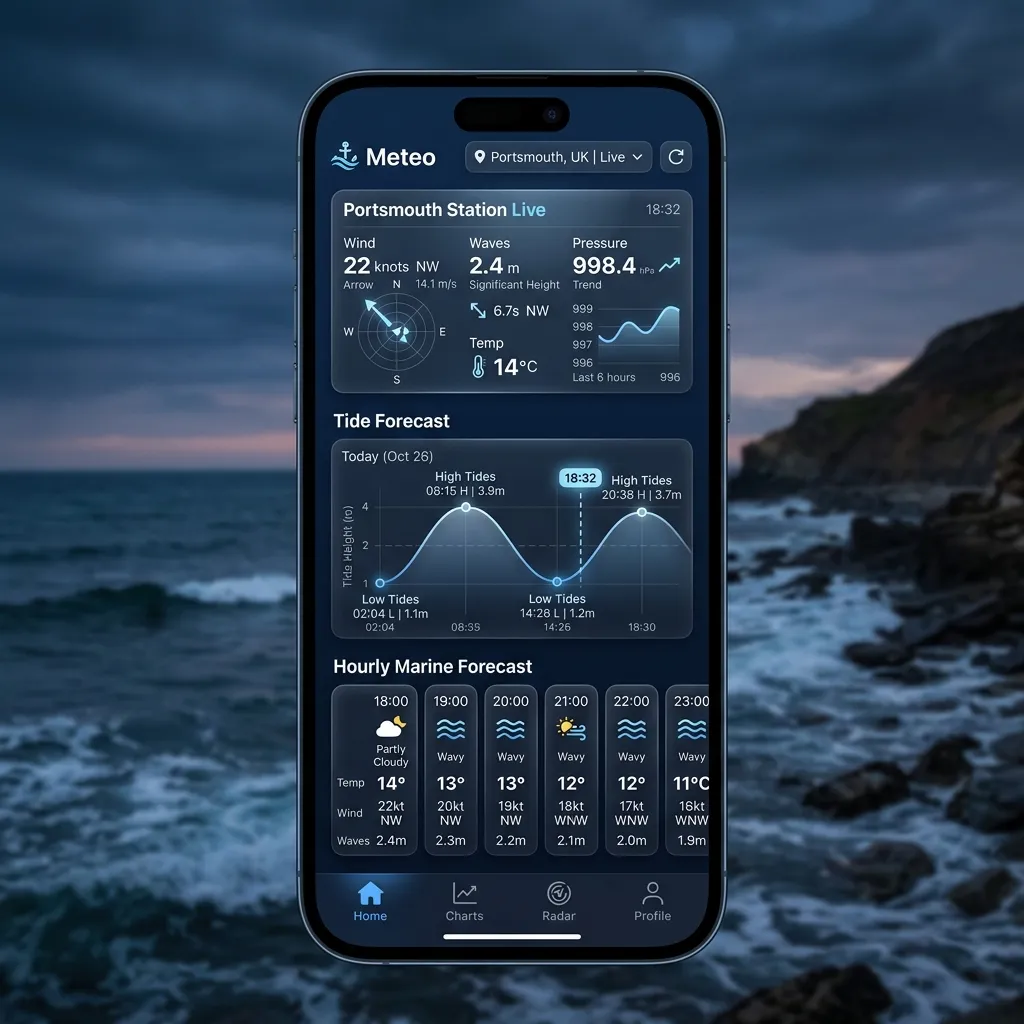
En live-instrumentpanel för den närmaste stationen, eller valfri station du sparar som
favorit. Högst upp på instrumentpanelen finns en intervallväljare
(12h · 24h · 3d · 7d); vad du än väljer driver varje graf och den timvisa karusellen
på en gång. Den här intervallväljaren är gratis — det finns ingen Pro-grind på den.
Stationskort
Kortets rubrik visar din plats (ort och land). Den källväder-/tidvattenstation som
används namnges precis under den — den stationen ligger ofta till havs eller en bit bort,
så rubriken talar om var avläsningen faktiskt gäller, medan underraden talar om vilken
station den kom från.
LUFT, KÄNNS, HAV och LUFTFUKTIGHET, bredvid den aktuella himmelsikonen och
beskrivningen.
tidvattenleverantören (NOAA eller Stormglass), väderleverantören (Open-Meteo eller
Stormglass), en bricka LIVE / CACHAD, en bricka FÖRUTSAGD när avläsningen är
ifylld från prognos, och det vertikala datumet (t.ex. MLLW) när det är känt.
nautiska mil och den lat / lon avläsningen gäller för.
…-knappen) — Uppdatera prognos, Byt station, Sparastation och Visa karta / Dölj karta.
mitthårkors koordinaten under korset; tryck på Hämta data för den här platsen för
att hämta prognosen för exakt den punkten, inte bara den fasta stationsnålen. Ditt eget
fartyg och stationen är båda markerade.
Grafer och karusell
Alla dessa följer intervallväljaren.
intervallet du valde (12 h upp till 7 dygn).
Beaufort-färgning, referenslinjer för Frisk vind (F6) och Kuling (F8), en
topp-byvind-markör och vindriktningspilar längs överkanten.
/ snö / dimma / åskväder, med en 50 %-"sannolik"-linje.
plus en liten "sätter mot"-kompasspil.
"ostadigt"-linje vid 1000 hPa och ett skuggat band, högtrycks-/lågtrycksvändmarkörer och
en 3-timmars-tendensbricka — plus den aktuella siktavläsningen.
märkta H/L-markörer, dag-/nattskuggning och en live-"Nu"-prick. En sammanfattning ovanför
den visar nästa Högvatten, den aktuella Nu-höjden (med en stigande/fallande trend)
och nästa Lågvatten.
Varje graf har en dragskrubbare: dra tvärs över den så följer avläsningen ovanför grafen
ditt finger; lyft av för att snäppa tillbaka till "Nu".
Var avläsningarna kommer ifrån
Meteo-fliken hämtar live marina data genom AnchorQueens backend, som hämtar per förfrågan
och cachelagrar resultatet (brickan CACHAD talar om när du ser en cachad hämtning).
Leverantörerna:
täckningszoner; Stormglass på andra håll, och som nödalternativ när NOAA inte kan nås.
nederbörd, vågor, sjögång och ström; Stormglass som nödalternativ.
som visas i Komfort-detaljbladet.
Tidvattenkurvan du ser är rekonstruerad från de hög-/lågvatten leverantören returnerar —
AnchorQueen fyller i den jämna formen mellan varje hög- och lågvatten (motsvarigheten till
sjömannens "tolftedelsregel"), så att du får en kontinuerlig, skrubbningsbar kurva i stället
för bara en lista över tider.
Händelser
Högst upp på Händelser-skärmen finns en Komfortmätare — en ring som visar ett
en-blicks-komfortbetyg för dina aktuella förhållanden, med den ledande faktorn namngiven
bredvid (t.ex. "Måttligt sjötillstånd", "+ 2 andra faktorer"). Använd den som det snabba
"är ikväll genomförbart"-svaret.
Tryck på mätaren (eller grafknappen bredvid den) för att öppna Komfort-detaljbladet,
som plottar din senaste komforthistorik och prognosen framåt så att du kan se om
förhållandena förbättras eller försämras.
Under mätaren finns listan över aktiva vädervarningar för ditt område — kulingvarningar,
stormbevakningar, varningar för småbåtar. Varje varning visar sin allvarlighetsgrad och sitt
meddelande, och är färgkodad efter allvarlighetsgrad (allvarlig / måttlig / rådgivande). När
inget är aktivt ser du i stället ett tillstånd "Inga aktiva händelser".
Meteogram
En separat, GFS-liknande grafisk prognos i staplade paneler, en variabel per rad:
Ett sammanfattningskort med aktuella förhållanden sitter överst, och — när stationen har
marina data — visar en horisontell strip Marina förhållanden under panelerna timvis
våghöjd, riktning och period. Tiden löper längs botten; slå på värdeinspektören (hårkors)
från …-menyn, och tryck eller dra sedan för att läsa exakta värden vid vilken tidpunkt som
helst. Samma meny låter dig spara eller dela meteogrammet som en PDF eller bild.
Tidsintervallfilter och plannivåer
Ovanför panelerna finns ett tidsintervallfilter — 6h · 12h · 24h · 3d · 7d. Till skillnad
från Marint väder-intervallväljaren är det här filtret Pro-grindat ovanför gratisnivåerna:
På en Free-plan visar knapparna 3d och 7d ett lås; att trycka på endera öppnar Butiken så
att du kan uppgradera.
Var data kommer ifrån
Leverantörerna bakom Marint väder, Händelser och Meteogrammet listas ovan under [Var
avläsningarna kommer ifrån](#oceanographic-engine); den fullständiga partnerlistan finns i
Inställningar → Datakällor och partner.
Att läsa vädret för ett beslut
Vädret är den enskilt största säkerhetsfaktorn till sjöss. Några sätt att använda de här
skärmarna för att göra ett kör/kör-inte-avgörande:
leta efter en sträcka där både vindlinjen och byvindsspåret sitter under din komfortgräns.
Referenslinjerna för Frisk vind (F6) och Kuling (F8) talar om i ett ögonkast när det börjar
bli allvarligt.
("Faller snabbt", "Faller mycket snabbt") och det skuggade sub-1000-hPa-bandet en
annalkande front eller by.
läs höjden, och addera den till det sjökortssatta djupet. Om sjökortet visar 1,8 m och
tidvattnet visar +0,6 m har du 2,4 m vatten — dra av ditt djupgående för marginalen.
Höjderna är relativa till stationens datum (t.ex. MLLW), visat på stationskortet.
lågvatten — för att undvika den starkaste strömmen. Sjötillstånd-kortets aktuella
"sätter-mot"-pil visar åt vilket håll den går.
Måttligt eller Grovt komfortbetyg betyder förhållanden som kommer utmana en ovan
besättning.
låg våghöjd och en frånlandsvind (som blåser land-till-hav) för det plattaste, klaraste
vattnet.
Om något går fel
…-menyn och Bytstation för att välja en sparad, eller öppna stationskartan och Hämta data för den här
platsen någonstans närmare kusten.
stationen; prova Uppdatera prognos från …-menyn.
värdena visas tills du återansluter. Se