Meteo — hava durumu, gel-gitler ve uyarılar
Meteo sekmesi, denize güvenmeden önce onu okumak için ihtiyacınız olan her
şeyi bir araya getirir.
Üstte bölümlü bir çubuğun üç bölümü vardır:
Denizel Hava Durumu — Olaylar — Meteogram.
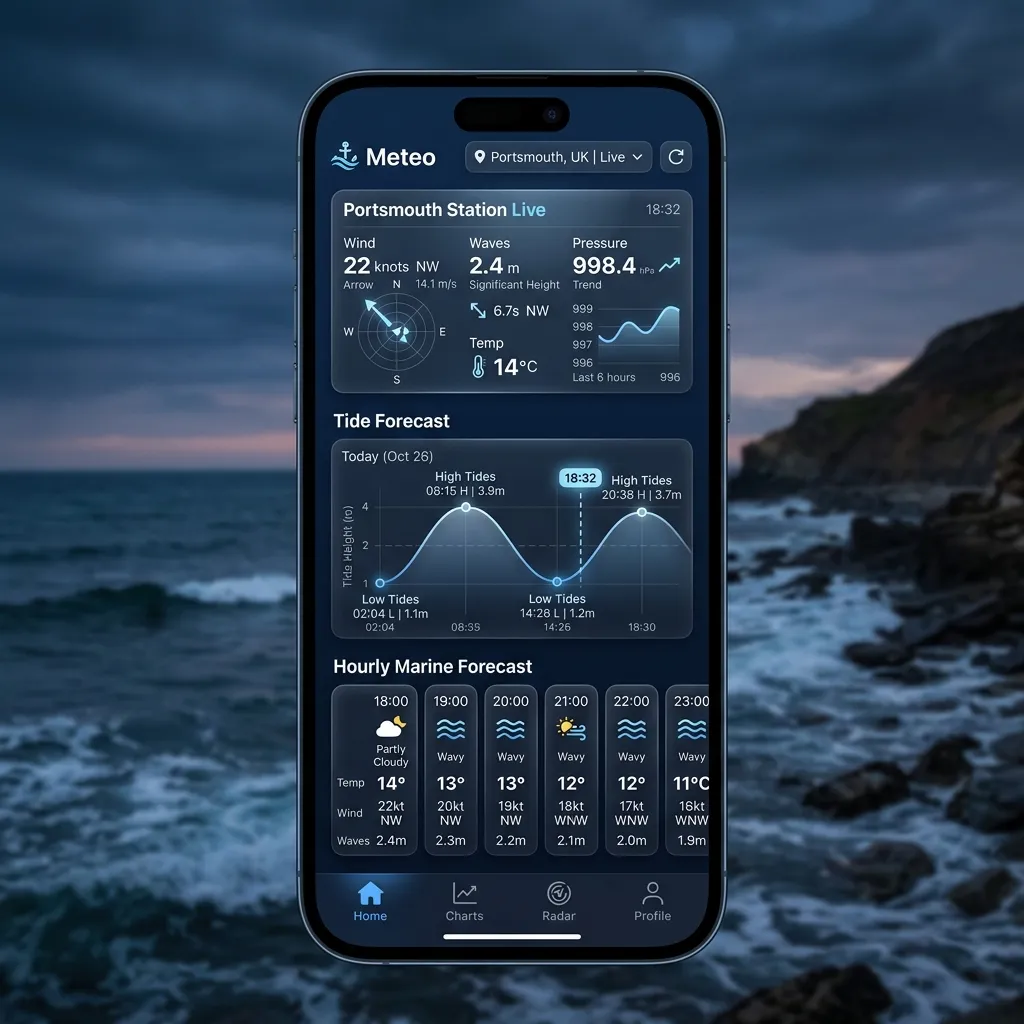
Denizel Hava Durumu
En yakın istasyon ya da favori olarak kaydettiğiniz herhangi bir istasyon
için canlı bir panel. Panelin üstünde bir aralık seçici
(12s · 24s · 3g · 7g) vardır; seçtiğiniz şey her grafiği ve saatlik
geçit dolabını aynı anda yönlendirir. Bu aralık seçici ücretsizdir — üzerinde
bir Pro kapısı yoktur.
İstasyon kartı
Kart başlığı konumunuzu (yer ve ülke) gösterir. Kaynak hava
durumu/gel-git istasyonu hemen altında adlandırılır — o istasyon genellikle
açıkta ya da bir miktar uzaktadır; bu yüzden başlık okumanın gerçekte nerede
geçerli olduğunu, alt satır ise hangi istasyondan geldiğini söyler.
simgesi ve açıklamasının yanında HAVA, HİSSEDİLEN, DENİZ ve
NEM.
sırası: gel-git sağlayıcısı (NOAA ya da Stormglass), hava durumu
sağlayıcısı (Open-Meteo ya da Stormglass), bir LIVE / CACHED
rozeti, okuma tahminden dolduğunda bir PREDICTED rozeti ve bilindiğinde
dikey referans (örneğin MLLW).
deniz mili cinsinden Mesafe ve okumanın yapıldığı Enl / Boyl.
… düğmesi) — Tahmini Yenile, İstasyon Değiştir,İstasyon Kaydet ve Haritayı Göster / Haritayı Gizle.
bir merkez artı imleç artının altındaki koordinatı gösterir; yalnızca
sabit istasyon iğnesi için değil, o tam nokta için tahmini çekmek üzere
Bu Konum İçin Veri Getir'e dokunun. Hem kendi tekneniz hem de istasyon
işaretlidir.
Grafikler ve geçit dolabı
Bunların hepsi aralık seçiciyi izler.
uzunluğu seçtiğiniz aralığı izler (12 s'ye kadar 7 güne kadar).
eğilim grafiği, Beaufort renklendirmesi, Sert-esinti (F6) ve Bora (F8)
referans çizgileri, bir tepe-hortum işaretçisi ve üst boyunca rüzgâr yönü
okları.
gök gürültülü fırtına olarak sınıflandırılmış, %50 "olası" çizgisiyle.
Her satır değeri artı küçük bir "yönüne akar" pusula okunu gösterir.
çizgisi ve gölgeli bant, sırt/alçak dönüş işaretçileri ve 3 saatlik bir
eğilim rozetiyle etkileşimli bir barometrik grafik — artı mevcut görüş
okuması.
işaretçileri, gündüz/gece gölgelemesi ve canlı bir "Şimdi" noktasıyla
etkileşimli bir gel-git eğrisi. Üzerindeki bir özet, bir sonraki
Yüksek'i, canlı Şimdi yüksekliğini (Yükselen / Alçalan eğilimiyle)
ve bir sonraki Alçak'ı gösterir.
Her grafiğin bir sürükle tarayıcısı vardır: boyunca sürükleyin, grafiğin
üzerindeki okuma parmağınızı izlesin; "Şimdi"ye geri kıvrılmak için
parmağınızı kaldırın.
Okumalar nereden gelir
Meteo sekmesi, canlı denizel veriyi AnchorQueen'in arka ucu üzerinden çeker;
istek başına getirir ve sonucu önbelleğe alır (CACHED rozeti, önbelleğe
alınmış bir çekme gördüğünüzde size söyler). Sağlayıcılar:
(MLLW referansına göre); diğer yerlerde Stormglass ve NOAA'ya
erişilemediğinde bir yedek olarak.
yağış, dalgalar, ölü deniz ve akıntı için Open-Meteo; yedek olarak
Stormglass.
ve tahmin geçmişini doldurmak için kullanılır.
Gördüğünüz gel-git eğrisi, sağlayıcının döndürdüğü yüksek/alçak sulardan
yeniden oluşturulur — AnchorQueen her yüksek ile alçak arasındaki pürüzsüz
şekli doldurur (denizcinin "onikiler kuralının" karşılığı); böylece yalnızca
bir zaman listesi yerine sürekli, taranabilir bir eğri elde edersiniz.
Olaylar
Olaylar ekranının üstünde bir Konfor Ölçer vardır — yanında önde gelen
etken adlandırılmış olarak (örneğin "Orta Deniz Durumu", "+ 2 diğer etken")
mevcut koşullarınız için bir bakışta bir konfor puanı gösteren bir halka.
Bunu "bu gece uygun mu" sorusunun hızlı yanıtı olarak kullanın.
Ölçere dokunun (ya da yanındaki grafik düğmesine), son konfor
geçmişinizi ve önümüzdeki tahmini çizen Konfor ayrıntı sayfasını
açın; böylece koşulların iyileşip iyileşmediğini ya da kötüleşip
kötüleşmediğini görebilirsiniz.
Ölçerin altında, alanınız için etkin hava durumu uyarılarının listesi
vardır — bora uyarıları, fırtına gözlemleri, küçük-tekne tavsiyeleri. Her
uyarı şiddetini ve mesajını gösterir ve şiddete göre renk kodludur (şiddetli /
orta / tavsiye). Hiçbir şey etkin olmadığında bunun yerine bir "Etkin olay
yok" durumu görürsünüz.
Meteogram
Yığın panellerde, satır başına bir değişken olan ayrı, GFS tarzı bir
grafiksel tahmin:
Üstte bir mevcut-koşullar özet kartı oturur ve — istasyonun denizel verisi
olduğunda — panellerin altındaki yatay bir Denizel Koşullar şeridi saatlik
dalga yüksekliğini, yönünü ve periyodunu gösterir. Zaman altta akar; …
menüsünden değer denetleyicisini (artı imleç) açın, sonra herhangi bir
zamanda kesin değerleri okumak için dokunun ya da sürükleyin. Aynı menü
meteogramı PDF ya da görüntü olarak kaydetmenizi ya da paylaşmanızı sağlar.
Zaman aralığı filtresi ve plan katmanları
Panellerin üzerinde bir zaman aralığı filtresi vardır — `6s · 12s · 24s · 3g ·
7g`. Denizel Hava Durumu aralık seçicisinin aksine, bu filtre ücretsiz
katmanların üzerinde Pro kapılıdır:
24 saate kadar.
Ücretsiz bir planda 3g ve 7g düğmeleri bir kilit gösterir; herhangi birine
dokunmak Mağaza'yı açar; böylece yükseltebilirsiniz.
Veri nereden gelir
Denizel Hava Durumu, Olaylar ve Meteogram'ın arkasındaki sağlayıcılar yukarıda
[Okumalar nereden gelir](#oceanographic-engine) altında listelenmiştir; tam
ortak listesi [Ayarlar → Veri Kaynakları ve
Ortaklar](settings.html#partners)'da.
Bir karar için hava durumunu okuma
Hava durumu denizdeki en büyük tek güvenlik etkenidir. Bu ekranları bir
git / gitme kararı vermek için kullanmanın birkaç yolu:
meteogramın rüzgâr panelinde), hem rüzgâr çizgisinin hem de hortum izinin
konfor sınırınızın altında oturduğu bir aralık arayın. Sert-esinti (F6) ve
Bora (F8) referans çizgileri, ne zaman ciddileştiğini bir bakışta söyler.
rozeti ("Hızla alçalıyor", "Çok hızlı alçalıyor") ve gölgeli alt-1000 hPa
bandı, yaklaşan bir cephe ya da bora işareti verir.
sürükleyin, yüksekliği okuyun ve haritalı iskandil derinliğine ekleyin.
Harita 1,8 m gösteriyorsa ve gel-git +0,6 m okuyorsa, 2,4 m suyunuz var —
pay için su çekiminizi çıkarın. Yükseklikler, istasyon kartında gösterilen
istasyonun referansına (örneğin MLLW) göredir.
için yüksek ya da alçak gel-git çevresindeki kısa duraklama. Deniz Durumu
kartının akıntı "yönüne-akar" oku hangi yöne aktığını gösterir.
limanda kalın demektir; Orta ya da Kaba bir konfor puanı, acemi bir
mürettebatı zorlayacak koşullar demektir.
keşfederken, en düz, en berrak su için düşük dalga yüksekliği ve *karadan
denize* (karadan denize esen) bir rüzgâr arayın.
Bir şeyler ters giderse
…menüsünü açın ve kaydedilmiş birini seçmek için İstasyon Değiştir ya da
istasyon haritasını açın ve kıyıya daha yakın bir yerde Bu Konum İçin Veri
Getir.
yanıtında yoktu; … menüsünden Tahmini Yenile'yi deneyin.
var; yeniden bağlanana kadar son değerler gösterilir. Bkz.